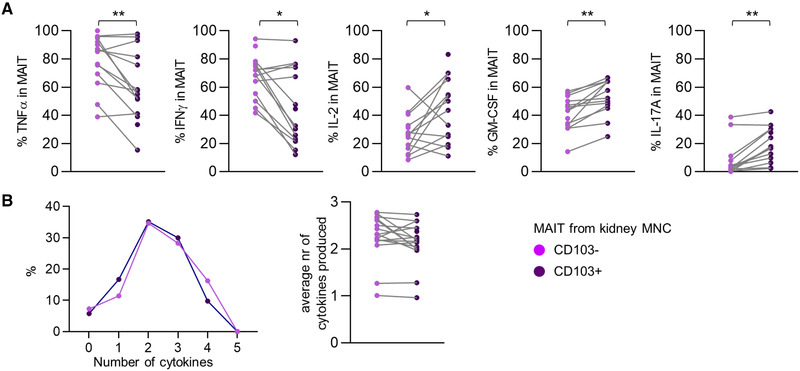
Figure 6.

CD103+ MAIT cells favor an IL‐2, GM‐CSF, and IL‐17‐producing profile. (A) Scatterplot of the percentage of TNFα‐, IFNү‐, IL‐2‐, GM‐CSF‐, or IL‐17A‐producing MAIT cells within CD103‐negative and CD103‐positive MAIT cell populations from kidney MNCs after stimulation with PMA and Ionomycin. (B) Graph of the median percentage of MAIT cells (Y‐axis) producing the stated number of cytokines (X‐axis) and scatterplot of the average number of cytokines produced by CD103‐negative and CD103‐positive MAIT cells from kidney MNCs after stimulation with PMA and Ionomycin. Wilcoxon signed rank test was used for statistical comparison. Only significant p‐values are displayed: *p < 0.05, **p ≤ 0.01, ***p ≤ 0.001. Data shown are representative of two independent flow cytometry experiments with n = 7 and 12 individuals per experiment. A total of 16 unique individuals are shown (healthy kidney = 3 and TX kidney = 13) (two samples did not contain sufficient CD103+ MAIT cells for analysis and one sample did not contain sufficient CD103‐ MAIT cells for analysis).
