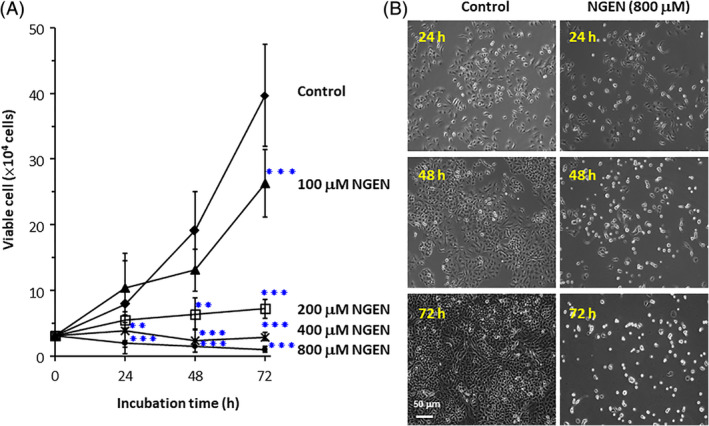
FIGURE 1.

Determination of NGEN sensitivity by Trypan blue viability assay. A, Cells were seeded into 12‐well plates. After 24 hours, cells were treated with various concentrations of NGEN (100, 200 400, and 800 μM) for the indicated time. The number of viable cells was determined by the Trypan blue dye exclusion method. Comparisons were performed using one‐way ANOVA with Dunnett post‐hoc test and considered significant at the **P < .01, or ***P < .001 level. B, Cell morphology was obtained by an Olympus IX 70 microscope with magnification of ×100 (scale bar, 50 μm). All the treatments were done in triplicate [Color figure can be viewed at wileyonlinelibrary.com]
