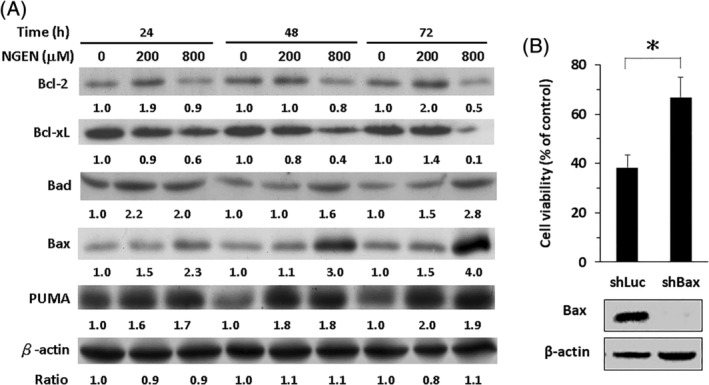
FIGURE 4.

Characterization of NGEN regulated proteins associated with apoptosis. A, A549 cells were treated without or with NGEN (200 or 800 μM) for 24, 48, and 72 hours. After treatment, cells lyses were extracted, and the levels of Bcl‐2 family proteins were analyzed by Western blot. B, A549‐shLuc cells and A549‐shBax cells were treated with 800 μM of NGEN for 24 hours. Cell viability was measured using direct cell counting by the Trypan blue dye exclusion method (upper panel). The expression of Bax was analyzed by Western blot (lower panel). Comparison was performed using Student's t test and considered significant at the *P < .05. Protein intensities were calculated using ImageJ (https://imagej.nih.gov/ij/) and the folds of change were as listed
