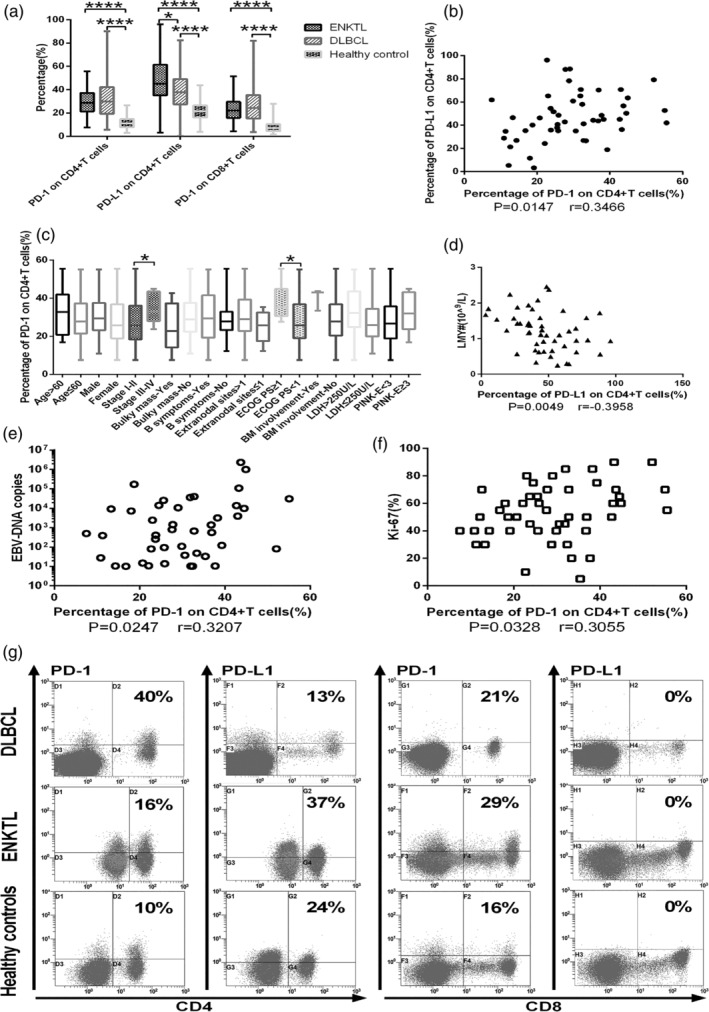
FIGURE 1.

A, Positive percentages of CD4+ or CD8+ T cells expressing PD‐1 or PD‐L1 from extranodal natural killer/T‐cell lymphoma (ENKTL) or diffuse large B‐cell lymphoma (DLBCL) or from healthy volunteers. B, Correlation between PD‐1 and PD‐L1 expression on CD4+ T cells from ENKTL patients. C‐F, Correlation of PD‐1 level of CD4+ T cells in ENKTL patients with C, disease stage and C, Eastern Cooperative Oncology Group performance (ECOG) score, D, lymphocyte count, E, number of Epstein‐Barr virus genome copies, and F, Ki‐67 index. G, Representative flow cytometry plots showing expression of PD‐1 or PD‐L1 on CD4+ or CD8+ T cells from one DLBCL patient, one ENKTL patient and one healthy control. ****P < .0001, **P < .01, *P < .05
