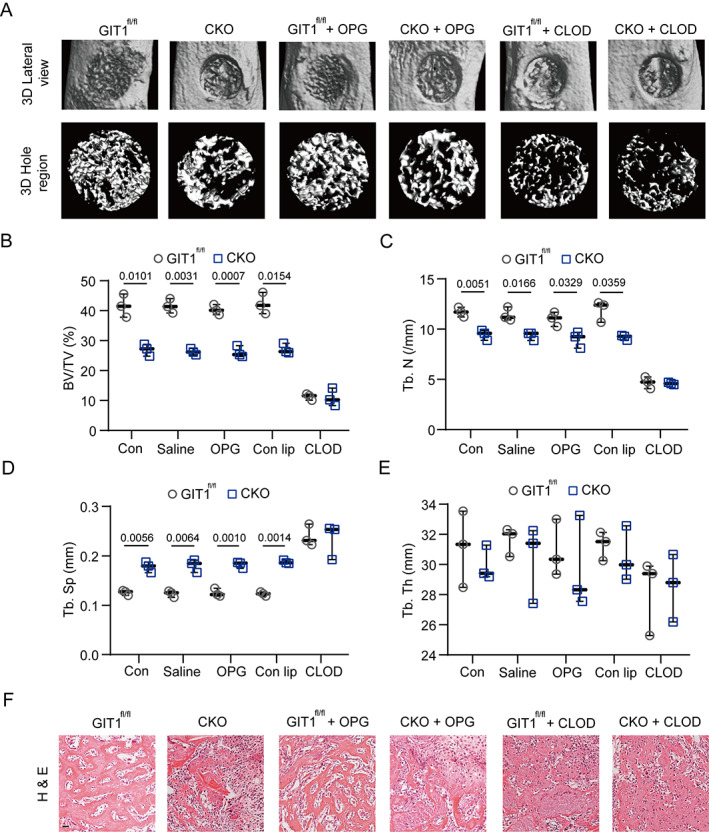
Fig. 1.

GIT1 CKO mice display impaired intramembranous bone formation of defects on day 7 post‐injury. (A) Representative images of micro‐CT reconstruction of injured tibias (top panel) and mineralized callus (lower panel) in the defect area of indicated groups. (B–E) BV/TV (%) (B), Tb.N (C), Tb.Sp (D), and Tb.Th (E) of the mineralized bone formed in the hole region were analyzed by micro‐CT (one‐way ANOVA with post hoc test). (F) Representative images of H&E staining in the hole region of indicated groups. Scale bar = 100 μm. BV = bone volume; TV = tissue volume; Tb.N = trabecular number; Tb.Sp = trabecular separation; Tb.Th = trabecular thickness; H&E = hematoxylin and eosin; OPG = osteoprotegerin; CLOD = clodronate liposomes.
