
Fig. 3.
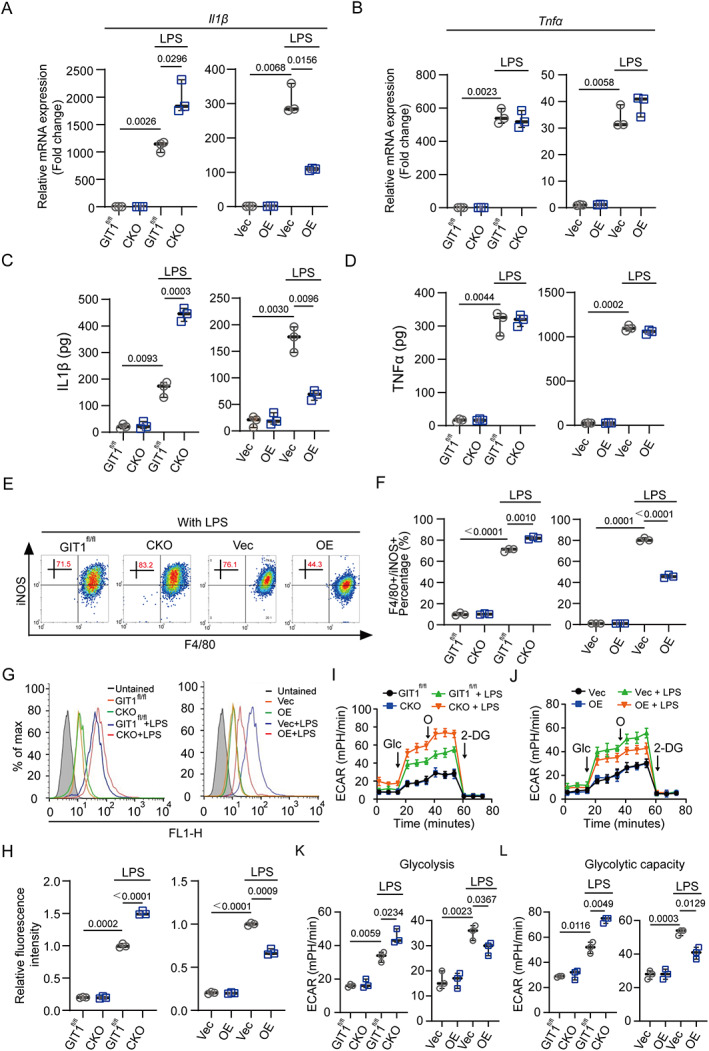
Macrophage GIT1 modulates the pro‐inflammatory response to LPS in vitro. (A, B) mRNA expression levels of IL1β (A) and TNFα (B) in BMDMs (GIT1fl/fl versus CKO) and RAW264.7 (Vec versus OE) cells from different groups with or without LPS treatment were detected by qPCR (two‐way ANOVA with post hoc test). (C, D) ELISA was used to determine the secreted IL1β (C) and TNFα (D) in a serum‐free conditioned medium from macrophages in different groups (GIT1fl/fl versus CKO, Vec versus OE) with or without LPS treatment (two‐way ANOVA with post hoc test). (E) Flow cytometry analysis of GIT1fl/fl and CKO BMDMs, and Vec and OE RAW264.7 cells in response to LPS. Dot plots represent F4/80 and iNOS staining. (F) Percentages of M1‐like (F4/80+ and iNOS+) macrophages with or without LPS treatment were accessed (two‐way ANOVA with post hoc test). (G) Analysis of ROS production by flow cytometry in GIT1fl/fl and CKO BMDMs (left panel) and Vec and OE RAW264.7 cells (right panel) with or without LPS treatment. (H) Quantification of ROS production in BMDMs and RAW264.7 cells of indicated groups (two‐way ANOVA with post hoc test). (I, J) ECAR measurement in GIT1fl/fl and CKO BMDMs (I), and Vec and OE RAW264.7 cells (J) with sequential addition of glucose (Glc), oligomycin (O), and 2‐deoxyglucose (2‐DG) via a seahorse bioscience XFp analyzer. (K, L) ECAR quantification of glycolysis (K) and glycolytic capacity (L) were determined in indicated groups (two‐way ANOVA with post hoc test). ROS = reactive oxygen species; ECAR = extracellular acidification rate.