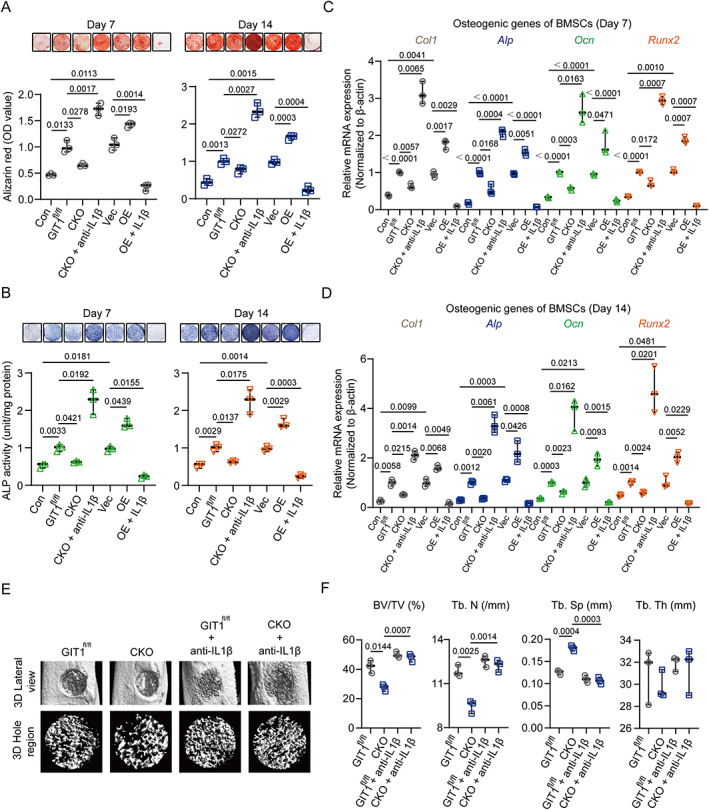
Fig. 4.

Macrophage GIT1 regulates BMSC osteogenic differentiation by modulating IL1β production. (A, B) BMSCs were cultured in an osteogenesis induction medium plus CM from LPS‐activated macrophages (BMDMs and RAW264.7 cells) from indicated treatment. BMSCs cultured in osteoblast differentiation medium alone were defined as the control group (con). After 7 and 14 days, matrix mineralization was determined via AR staining (top panel of A) and ALP staining (top panel of B). Quantitative analyses of AR staining (lower panel of A) and ALP activities (lower panel of B) on days 7 and 14 are shown (two‐way ANOVA with post hoc test). (C, D) After 7 and 14 days, mRNA expression levels of osteoblast‐specific genes (Col1, Alp, Ocn, and Runx2) of indicated groups were detected by qPCR. β‐Actin was used as an internal control (two‐way ANOVA with post hoc test). (E) Representative 3D reconstruction images of injured tibias (top panel) and mineralized callus (lower panel) in the defect area of GIT1fl/fl and GIT1 CKO mice with or without anti‐IL1β blocking antibody treatment. (F) BV/TV (%), Tb.N, Tb.Sp, and Tb.Th of the mineralized bone formed in the defect region were analyzed using micro‐CT (two‐way ANOVA with post hoc test). CM = conditioned media; AR = alizarin red; ALP = alkaline phosphatase.
