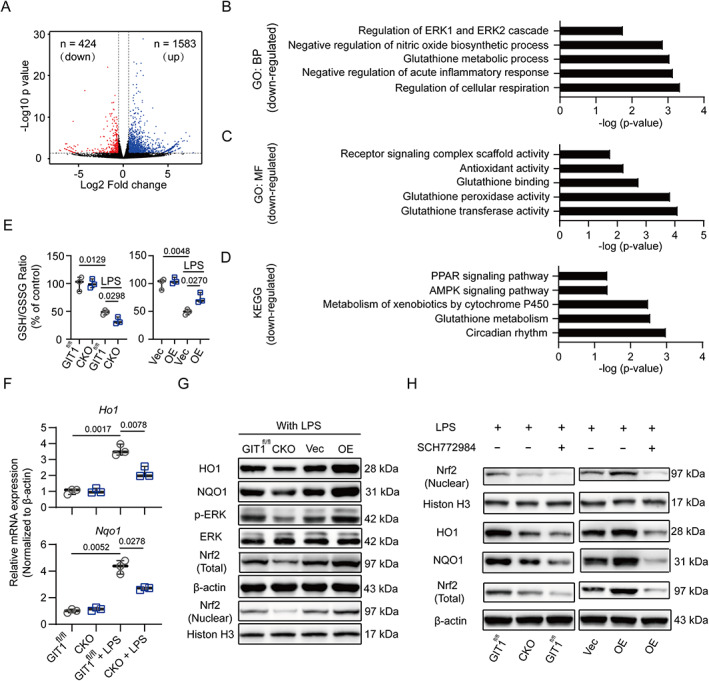
Fig. 5.

Macrophage GIT1 activates NRF2 by phosphorylating ERK in response to LPS. (A) Volcano plot of genes of GIT1fl/fl and CKO BMDMs in response to LPS. Blue and red dots represent up‐ and downregulated DEGs, respectively. (B–D) Representative BP (B) and MF (C) categories using GO analyses and KEGG pathways (D) based on downregulated DEGs affected by GIT1 depletion in BMDMs after LPS treatment. (E) Determination of the GSH/GSSG ratio in BMDMs and RAW264.7 cells of indicated groups (two‐way ANOVA with post hoc test). (F) mRNA expressions of NRF2 target genes (Ho1 and Nqo1) in BMDMs of GIT1fl/fl and CKO groups with or without LPS were detected using qPCR. GAPDH was used as an internal control (two‐way ANOVA with post hoc test). (G) Western blotting indicated the altered protein expression levels of HO1, NQO1, p‐ERK/ERK, NRF2 (nuclear), and NRF2 (total) in indicated groups of macrophages (BMDMs and RAW264.7 cells) after LPS treatment. (H) Western blotting analysis of NRF2 (nuclear) and NRF2 (total) in BMDMs of indicated groups treated with SCH772984 (an ERK inhibitor). BP = biological process; MF = molecular function; GO = gene ontology; KEGG = Kyoto encyclopedia of genes and genomes; GSH = reduced glutathione; GSSG = oxidized glutathione.
