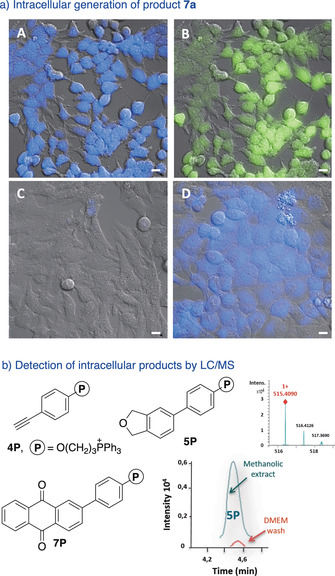
Figure 4.

Intermolecular cycloadditions in live cells. a) Fluorescence micrographies of HeLa cells (brightfield) after incubation with: A) Ru2, washed, and treated with 6 a and 4 a; B) similar, but observation under the green channel; C) 6 a and 4 a; D) product 7 a. b) Products with the triphenylphosphonium tails. Extracted ion chromatogram of the product 5P generated intracellularly (methanolic extract) and also that detected in the DMEM washings, before the extraction; (inset) mass spectrum of 5P. Conditions: HeLa cells pretreated with 50 μm of Ru2 for 50 min were washed twice and incubated with 50 μm of substrate (3 a or 6 a) and 150 μm of alkynes (either 4 a or 4P) for 4 h. Blue channel: λ exc=385 nm, λ em=410–480 nm; green channel: λ exc=470 nm, λ em=490–580 nm. Scale bar: 12.5 μm.
