FIGURE 3.

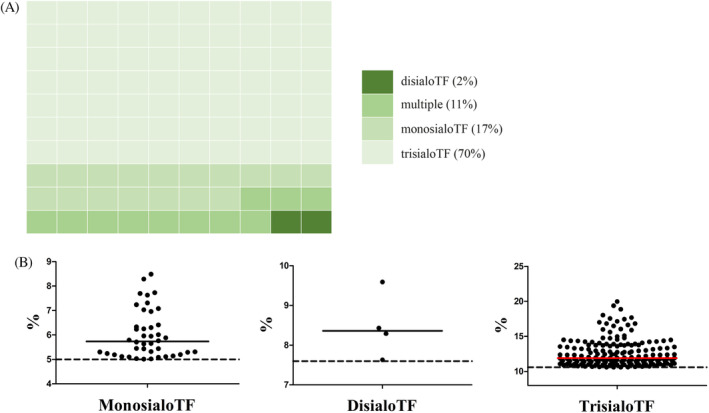
Abnormal tIEF result. A, Waffle chart that shows the distribution of the abnormal tIEF samples. B, Individual medians for the abnormal samples per TF isoform. The dotted line represents upper limit of normal based on internal standards

Abnormal tIEF result. A, Waffle chart that shows the distribution of the abnormal tIEF samples. B, Individual medians for the abnormal samples per TF isoform. The dotted line represents upper limit of normal based on internal standards