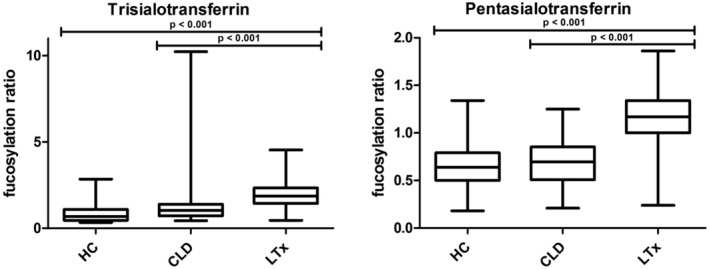
FIGURE 4.

Boxplots of the fucosylation ratio of the tri‐ and pentasialoTF QTOF‐MS isoforms. The left graph shows the fucosylation ratio of trisialotransferrin, or peak 79 266 Da. The right graph shows the fucosylation ratio of pentasialotransferrin, or peak 80 211 Da. We used a Kruskal‐Wallis test for calculation of P values. CLD, chronic liver disease; HC, healthy controls; LTx, liver transplantation
