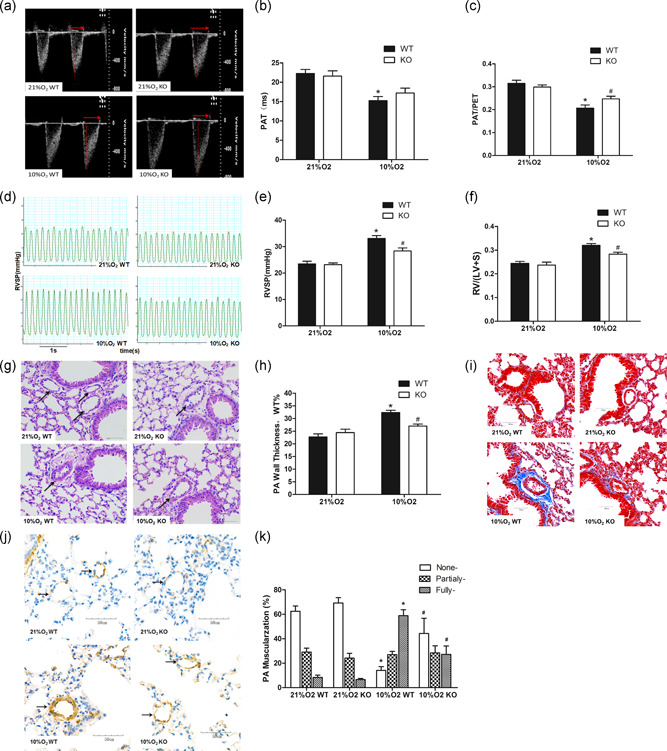
Figure 4.

MFG‐E8 gene knockout and pulmonary hypertension induced by chronic hypoxia in mice. (a) Representative pulse‐wave doppler images across the pulmonary outflow tract. The time to peak flow acceleration across the pulmonary valve decreases with increasing pulmonary artery pressure, and the ratio of PAT/PET varies and is inverse to pulmonary artery pressure. (b,c) PAT and PAT/PET demonstrated that pulmonary artery resistance increased by chronic hypoxia and is alleviated in the MFG‐E8 knockout; n = 6. (d) Representative RVSP images showing that pulmonary vascular resistance differed between the four groups. (e) RVSP alteration in MFG‐E8 gene knockout and/or chronic hypoxia‐induced mice; n = 6. (f) Changes in Fulton's index, and the ratio of right ventricular to left ventricular plus septal weight, RV/(LV + S), in four groups of mice; n = 6. (g) Representative hematoxylin and eosin‐stained mouse lung tissue sections showed vascular remodeling in small pulmonary arteries. (h) Quantification of wall thickness (WT%) indicated attenuated vascular remodeling in MFG‐E8−/− mice; n = 6. (i) Representative Masson staining of collagen deposition around mouse pulmonary arteries. (j) Representative α‐sma stained distal pulmonary arteries indicated vascular muscularization differences between the four groups. (k) Chronic hypoxia‐induced distal muscularization, while MFG‐E8 null mice showed an alleviation of the muscularization; n = 5–6. The results are expressed as the mean ± SEM, *p < .05 compared with the 21% O2 WT group, and # p < .05 compared with the 10% O2 WT group. KO, knockout; MFG‐E8, milk fat globule‐EGF factor 8; NC, negative control; PAT/PET, pulmonary acceleration time to total pulmonary ejection time; RVSP, right ventricular systolic pressure; WT, wild type
