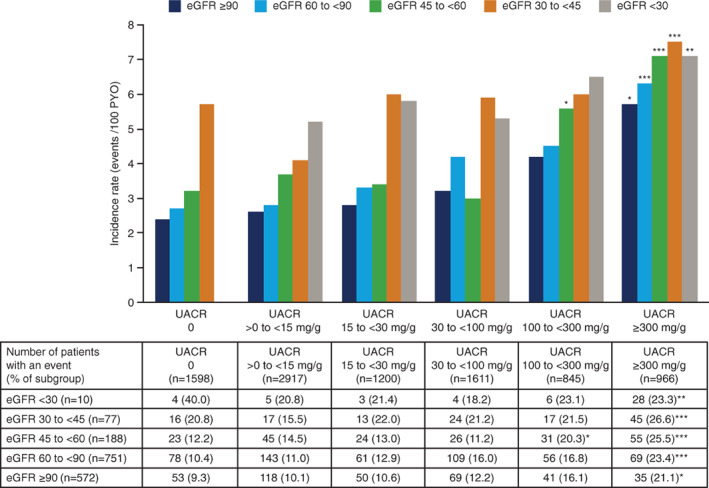
FIGURE 3.

Rates of MACE by baseline UACR and eGFR subgroups in the pooled analyses. *P < .05; **P < .01; ***P < .0001; all vs. UACR 0 with eGFR ≥90 mL/min/1.73m2. P‐values are Bonferroni‐adjusted. eGFR is presented in mL/min/1.73m2. Some of the relevant subgroups were small, particularly at the lowest baseline eGFR levels (<30 mL/min/1.73m2), where recruitment was limited by trial design. The rate of MACE in the subgroup with UACR 0 and eGFR <30 mL/min/1.73m2 was 12 events/100 PYO. The UACR 0 and eGFR <30 mL/min/1.73m2 subgroup only included 10 patients and this outlying rate of MACE, which is not shown in the bar chart, was based on four events (n = 4 patients with first MACE). eGFR, estimated glomerular filtration rate; MACE, major adverse cardiovascular events; PYO, patient‐years of observation; UACR, urinary albumin‐to‐creatinine ratio; UACR 0, urinary albumin < lower limit of quantification
