Figure 1.

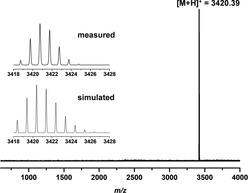
MALDI‐TOF mass spectrum of 2. The inset shows the isotopic distribution pattern of the molecular ion peak by HR‐MALDI MS.

MALDI‐TOF mass spectrum of 2. The inset shows the isotopic distribution pattern of the molecular ion peak by HR‐MALDI MS.