
Figure 5. KATP channels and dysregulation of glucagon secretion in diabetes.
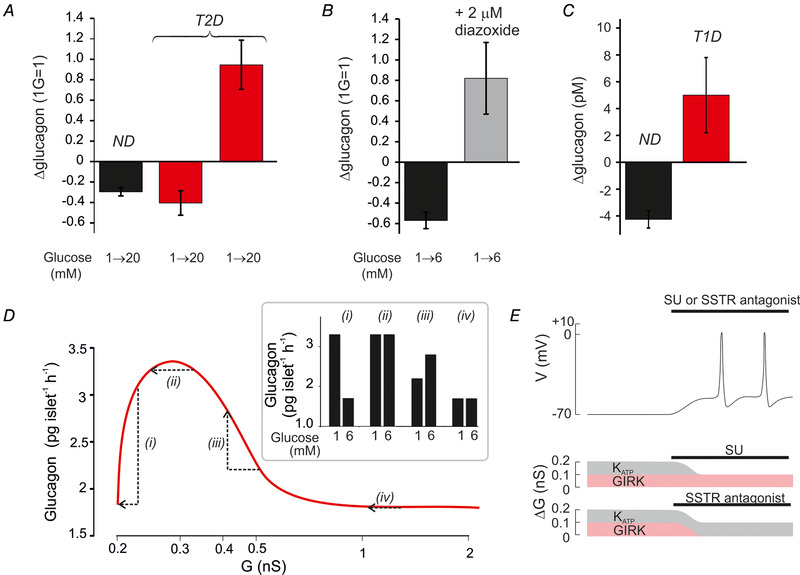
A, relative change in glucagon secretion measured in islets from healthy donors (n = 40) and donors diagnosed with T2D (n = 10) in response to an elevation of glucose from 1 to 20 mm. Responses in T2D islets fell into two groups; one with normal regulation (n = 5) and one with inverted regulation (n = 5). B, glucagon secretion in islets from two healthy organ donors at 1 and 6 mm glucose in the absence and presence of 2 μm diazoxide. C, net change of plasma glucagon measured in healthy individuals and in patients with T1D 4 h after administration of the SU glimepiride (4 mg, orally). Data from Cooperberg & Cryer (2009) (redrawn). D, relationship between total whole‐cell K channel conductance (G) and glucagon secretion (continuous curve) in T2D patients with normal KATP channel regulation (i) and with small (ii), moderate (iii) or large (iv) increases in KATP channel activity. The arrows indicate the changes in glucagon secretion produced by an elevation of glucose from 1 to 6 mm. The bar graphs (Inset) show the predicted effects of increasing glucose with variable degrees of basal KATP channel hyperactivity. E, schematic illustrating the effects of SU or an SSTR antagonist. The α‐cell is initially repolarized (top trace) because resting whole‐cell K+ conductance in excess of background (ΔG) is increased from the optimal 0.1 nS to 0.2 nS (see Fig. 2). This increase may result from either an increase in KATP (grey; due to a metabolic defect in the α‐cells) and/or GIRK (red; due to increased somatostatin release from δ‐cells) channel activity. Inhibition of KATP channels with SU (middle) or GIRK channels with an SSTR antagonist reduces ΔG to the 0.1 nS, which is optimal for α‐cell electrical activity and glucagon secretion.