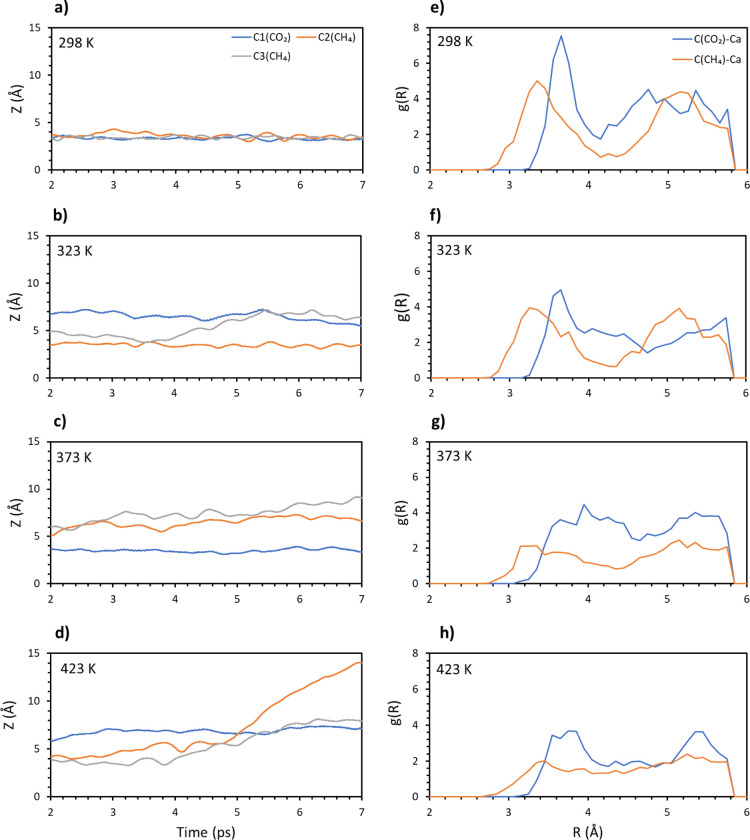
Figure 6.
Carbon (CO2 and CH4) distances from the surface vs time for the 1:2 composition at different temperatures: (a) 298, (b) 323, (c) 373, and (d) 423 K. Radial distribution function of the molecular carbon–topmost calcium pair for the 1:2 composition. Different temperatures have been considered: (e) 298, (f) 323, (g) 373, and (h) 423 K.

