
FIGURE 4.
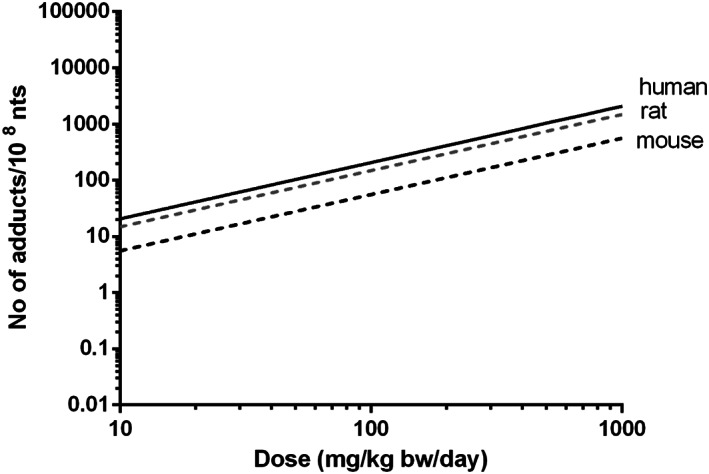
PBK modeling‐based reverse dosimetry predicted in vivo dose‐response curves for DNA adduct formation in the kidney of rat (gray dashed line), mouse (black dashed line) and human (black solid line). Formed adducts are presented as number of adducts per day. bw, body weight; nts, nucleotides