
FIGURE 7.
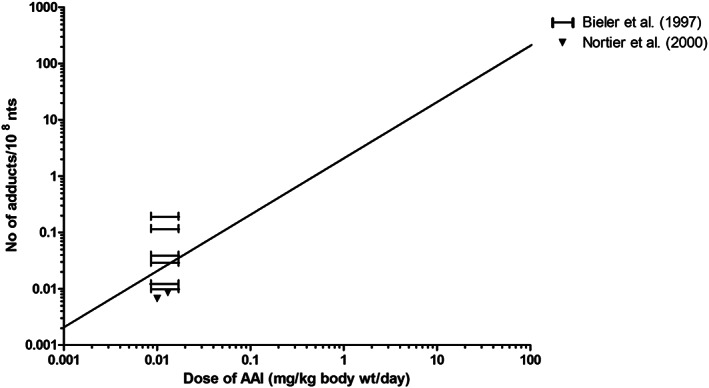
Comparison of PBK modeling‐based reverse dosimetry predicted dose‐dependent AAI‐DNA adduct formation in the kidney of humans (straight line) exposed orally to AAI to data on AAI‐DNA adduct formation in patients with AAN, as obtained from the literature. Formed adducts are presented as number of adducts per day. See Table 3 for specifications for the human studies, where the study from Bieler et al. (1997) presents data based on the estimated range of exposure from different individuals. AAI, aristolochic acid I; wt, weight; nts, nucleotides