
Figure 5.
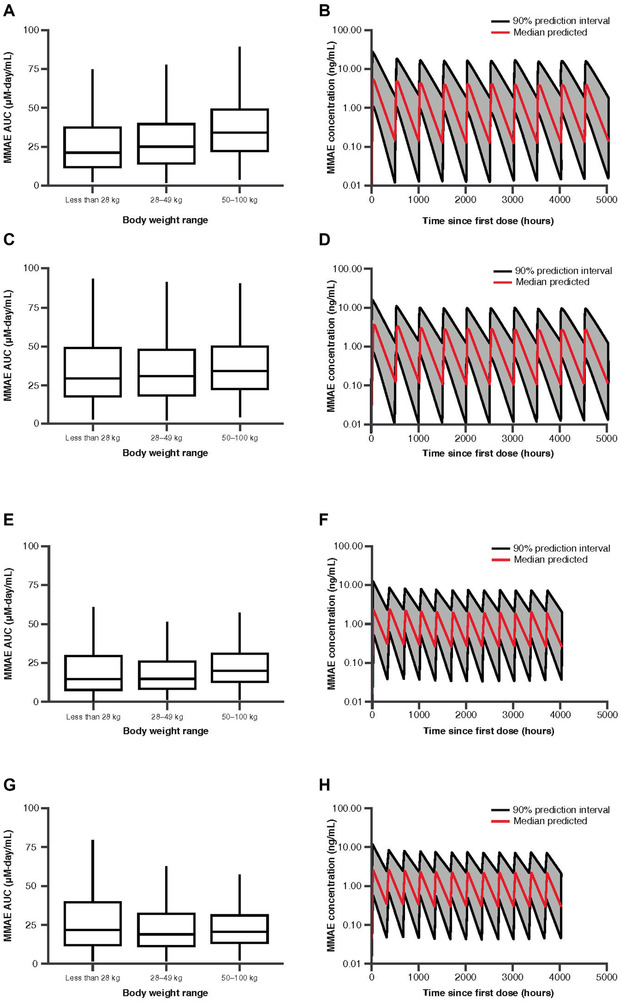
Simulated MMAE AUC by body weight range (A, C, E, G) and concentration‐to‐time profiles (B, D, F, H) following 1.8 mg/kg every‐3‐week dosing (A, B), 71.5 mg/m2 every‐3‐week dosing (C, D), 1.2 mg/kg every‐2‐week dosing (E, F), and 47.7 mg/m2 every‐2‐week dosing (G, H). Each box plot illustrates: the median by the horizontal line in the center, the 25th percentile by the lower end of the box, the 75th percentile by the upper end of the box, the 5th percentile by the lower whisker, and the 95th percentile by the upper whisker. AUC, area under the concentration‐to‐time curve; MMAE, monomethyl auristatin E.