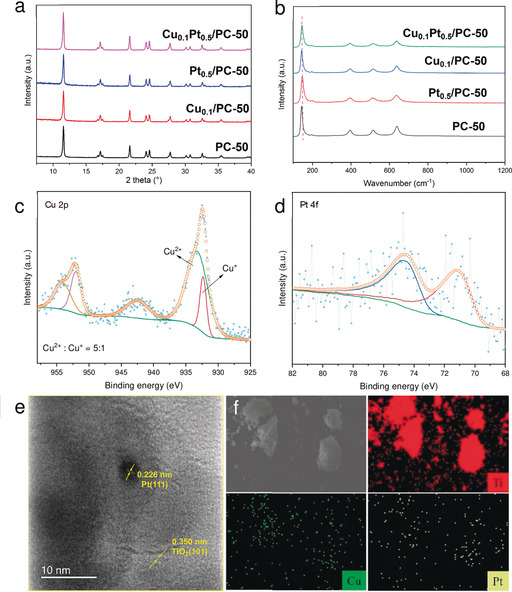
Figure 1.

a) PXRD and b) Raman spectra of Cu0.1Pt0.5/PC‐50, Pt0.5/PC‐50, Cu0.1/PC‐50, and PC‐50. c) Cu 2p XPS spectra of Cu2.0/PC‐50. d) Pt 4f XPS spectra of Cu0.1Pt0.5/PC‐50. e) HR‐TEM image of Cu0.1Pt0.5/PC‐50. f) EDX elemental mapping (Ti, Cu, and Pt) of Cu0.1Pt0.5/PC‐50.
