Abstract
We report a facile strategy for developing reagentless amperometric pyruvate biosensors based on enzyme nanoparticles (EnNPs). The EnNPs were prepared using pyruvate oxidase crosslinked with graphene quantum dots. Before EnNP immobilization, screen-printed carbon electrodes (SPCEs) were modified with Prussian blue, a biocompatible coordination polymer. The biosensor system was optimized in terms of the working potential and pH value. At pH 7.0 in 50 mM phosphate-buffered solution, the biosensor showed optimal characteristics under an applied potential of −0.10 V versus an internal pseudo-Ag reference electrode. Using these optimized conditions, the biosensor performance was characterized via the chronoamperometric technique. The EnNP-immobilized SPCE exhibited a dynamic linear range from 10 to 100 μM for pyruvate solution, and a sensitivity of 40.8 μA mM–1 cm–2 was recorded. The observed detection limit of the biosensor was 0.91 μM (S/N = 3) and it showed strong anti-inference capability under the optimized working potential. Furthermore, the practical applicability of the proposed biosensor was studied in fish serum samples.
1. Introduction
Metabolomics has been extensively applied to disease diagnosis in microbes, plants, and animals. As low-molecular weight chemical entities, metabolites are related to the genome and proteome as the downstream products of omics, and they can represent the phenotype of an organism. In aquaculture, fish health-related applications of metabolomics are being rapidly developed; this is because the successful control of diseases in farmed fish is a major challenge for aquaculturists with regard to improving food quality and safety.1 Most such studies investigated the interaction between the fish hosts and pathogens (bacterial, viral, or parasitic)2,3 or identified disease biomarkers in the host responses.4,5 For example, palmitic acid and mannose were found to be crucial biomarkers in the serum of Edwardsiella tarda-infected crucian carp.5 The discovery of potential metabolite biomarkers allows the development of simple assays for monitoring the physiological conditions (stress, diseases, and nutritional status) of fish. Nuclear magnetic resonance (NMR) spectroscopy and mass spectrometry (MS) are the typical analytical techniques for detecting metabolites in real samples.6 NMR-based metabolomics has substantial advantages such as high reproducibility and requirement of minimal pretreatment. In particular, high-resolution magic angle spinning (HR-MAS) NMR spectroscopy can directly measure intact samples without any extraction processes or experimental errors. Nevertheless, these techniques do not always allow simple and continuous monitoring, are rather expensive, and/or require well-trained technicians or complicated sample pretreatment steps. These issues lead to increased time consumption and low cost efficiency.
Biosensors designed specifically for metabolite detection are promising alternatives to the platforms based on NMR and MS. Although they are yet to be extensively adopted in the aquaculture field, biosensors have been widely employed to diagnose diseases in humans.7,8 Taking advantage of their good selectivity and affordability to facilely build compact equipment, biosensors may be easily integrated into automation schemes to allow rapid real-time monitoring of fish samples.9
Pyruvate (Py) is an important metabolite, whose sensitive and rapid detection is needed in the study of fish metabolic diseases. For selective detection of Py using electrochemical biosensors, the enzyme pyruvate oxidase (PoxB) is usually immobilized as the recognition element.10 Several enzymatic Py biosensors have been reported,11−13 and they are all based on PoxB, which catalyzes the following enzymatic reaction (TPP = thiamine pyrophosphate)
| 1 |
| 2 |
H2O2 produced in Reaction 1 can be electrochemically oxidized or reduced on the surface of the working electrode, proving that the current is directly proportional to the pyruvate concentration.
However, PoxB requires three additional cofactors [Mg2+ ions, flavin adenine dinucleotide (FAD), and TPP] in optimized concentrations in the working buffer. Moreover, the enzyme’s stability, conformation on the working electrode, and adsorption capacity are crucial factors in developing enzyme-based biosensors. For these reasons, significant efforts have been made toward reagent-free systems. The efficient coimmobilization of enzymes, cofactors, or mediators with nanomaterials such as boronate-substituted polyaniline,14 polypyrrole,15 and graphene oxide16 films has been reported. Most of these reports focused on Reaction (2) by measuring H2O2 oxidation in the anodic region under a high applied potential (∼+0.6 V). However, these H2O2 sensors are highly susceptible to electrochemical interferences.12,17,18 To avoid this problem, in this study, we instead designed a Py biosensor to enhance H2O2 reduction in the cathodic region under a low applied potential range.
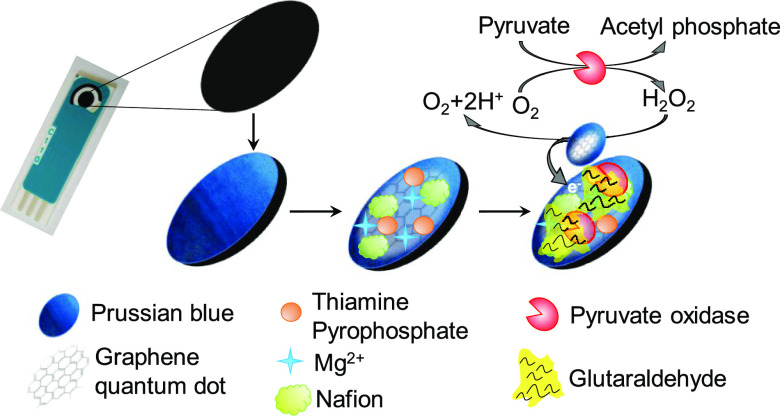
In this study, an efficient reagentless PoxB-based Py biosensor was easily fabricated using a screen-printed carbon electrode (SPCE) modified with Prussian blue (PB) nanoparticles and graphene quantum dots (GQDs). PB has been shown to be the most advantageous nanoparticle material for H2O2 sensors. PB-modified electrodes are more active than widely used platinum-modified ones for H2O2 reduction and oxidation in neutral media and are more selective in the presence of oxygen, both by 3 orders of magnitude.19,20 Meanwhile, the GQDs ensure good biocompatibility and further immobilization of PoxB on the electrode surface. In recent years, enzyme immobilization or conjugation onto nanoparticles has been widely utilized to prepare enzyme nanoparticles (EnNPs). The EnNPs have shown high enzyme loading and improved enzyme stability because these nanoparticle carriers have a large specific surface area for attachment.21 We crosslinked PoxB with GQDs to prepare PoxB-immobilized nanoparticles (PoxBNPs). After electrodepositing PB on the surface of the SPCE, the PoxBNPs were drop casted to fabricate the EnNP-based Py biosensor (PoxBNP/PB/SPCE). The prepared biosensor was optimized in terms of the applied potential and pH of the buffer solution. Under the optimum conditions, it was successfully used to detect Py in real fish serum samples.
2. Results and Discussion
2.1. Physical Characterization of the Differently Modified Electrodes
The electrode surfaces were characterized via FE-SEM to assess the morphology change after each modification step (PB/SPCE and PoxBNP/PB/SPCE) and the results are shown in Figure 1. The bare SPCE displays a rough and wrinkled morphology (Figure 1a). On the PB-modified SPCE, nanosphere/cluster-like structures were observed, and the average diameter of the nanospheres was ∼105 nm (Figure 1b), demonstrating the successful electrodeposition of PB nanoparticles on the SPCE. After the immobilization of PoxBNPs, the surface became relatively smooth, as seen in Figure 1c. This result suggests that the enzyme was successfully immobilized on the modified SPCE. The presence of major elements and their amounts were analyzed using the EDS technique combined with SEM. The EDS spectrum analysis and elemental mapping for the bare SPCE, PB/SPCE, and PoxBNP/PB/SPCE are done, as shown in Figures S1–S4. The bare SPCE shows a characteristic carbon peak alone (Figure S1a); the PB-modified SPCE shows evidence of Fe, which again confirms the successful PB electrodeposition (Figure S1b). Moreover, the PoxBNP-modified surface (Figure S1c) features N, P, and Mg, further proving that the cofactors and enzymes were successfully immobilized.
Figure 1.
FE-SEM images of (a) bare SPCE, (b) PB/SPCE, and (c) PoxBNP/PB/SPCE. Scale bar: 3 μm.
2.2. Voltammetric Response of Differently Modified Electrodes
Electrocatalytic reduction of H2O2 was carried out via CV on the unmodified and modified electrodes (bare SPCE, GQD/SPCE, PB/SPCE, and GQD/PB/SPCE). Figure 2a shows the cyclic voltammograms of the electrodes in N2-saturated 50 mM PBS (pH 7.0) in the absence (dashed line) and presence (solid line) of 0.50 mM H2O2 at a scan rate of 10 mV s–1. The H2O2 reduction peak was observed for all the electrodes in the negative-potential region. We also measured the cathodic peak current (ipc) at −0.10 V and plotted it in Figure 2b. The ipc value of the GQD/PB/SPCE was two times higher than that of the other electrodes. Apparently, the presence of a heterogeneous layer of GQDs and PB improved the electron transfer kinetics. On the GQD/PB/SPCE, the mechanism of catalytic reduction of H2O2 mimics that of the horseradish peroxidase film system.
Figure 2.
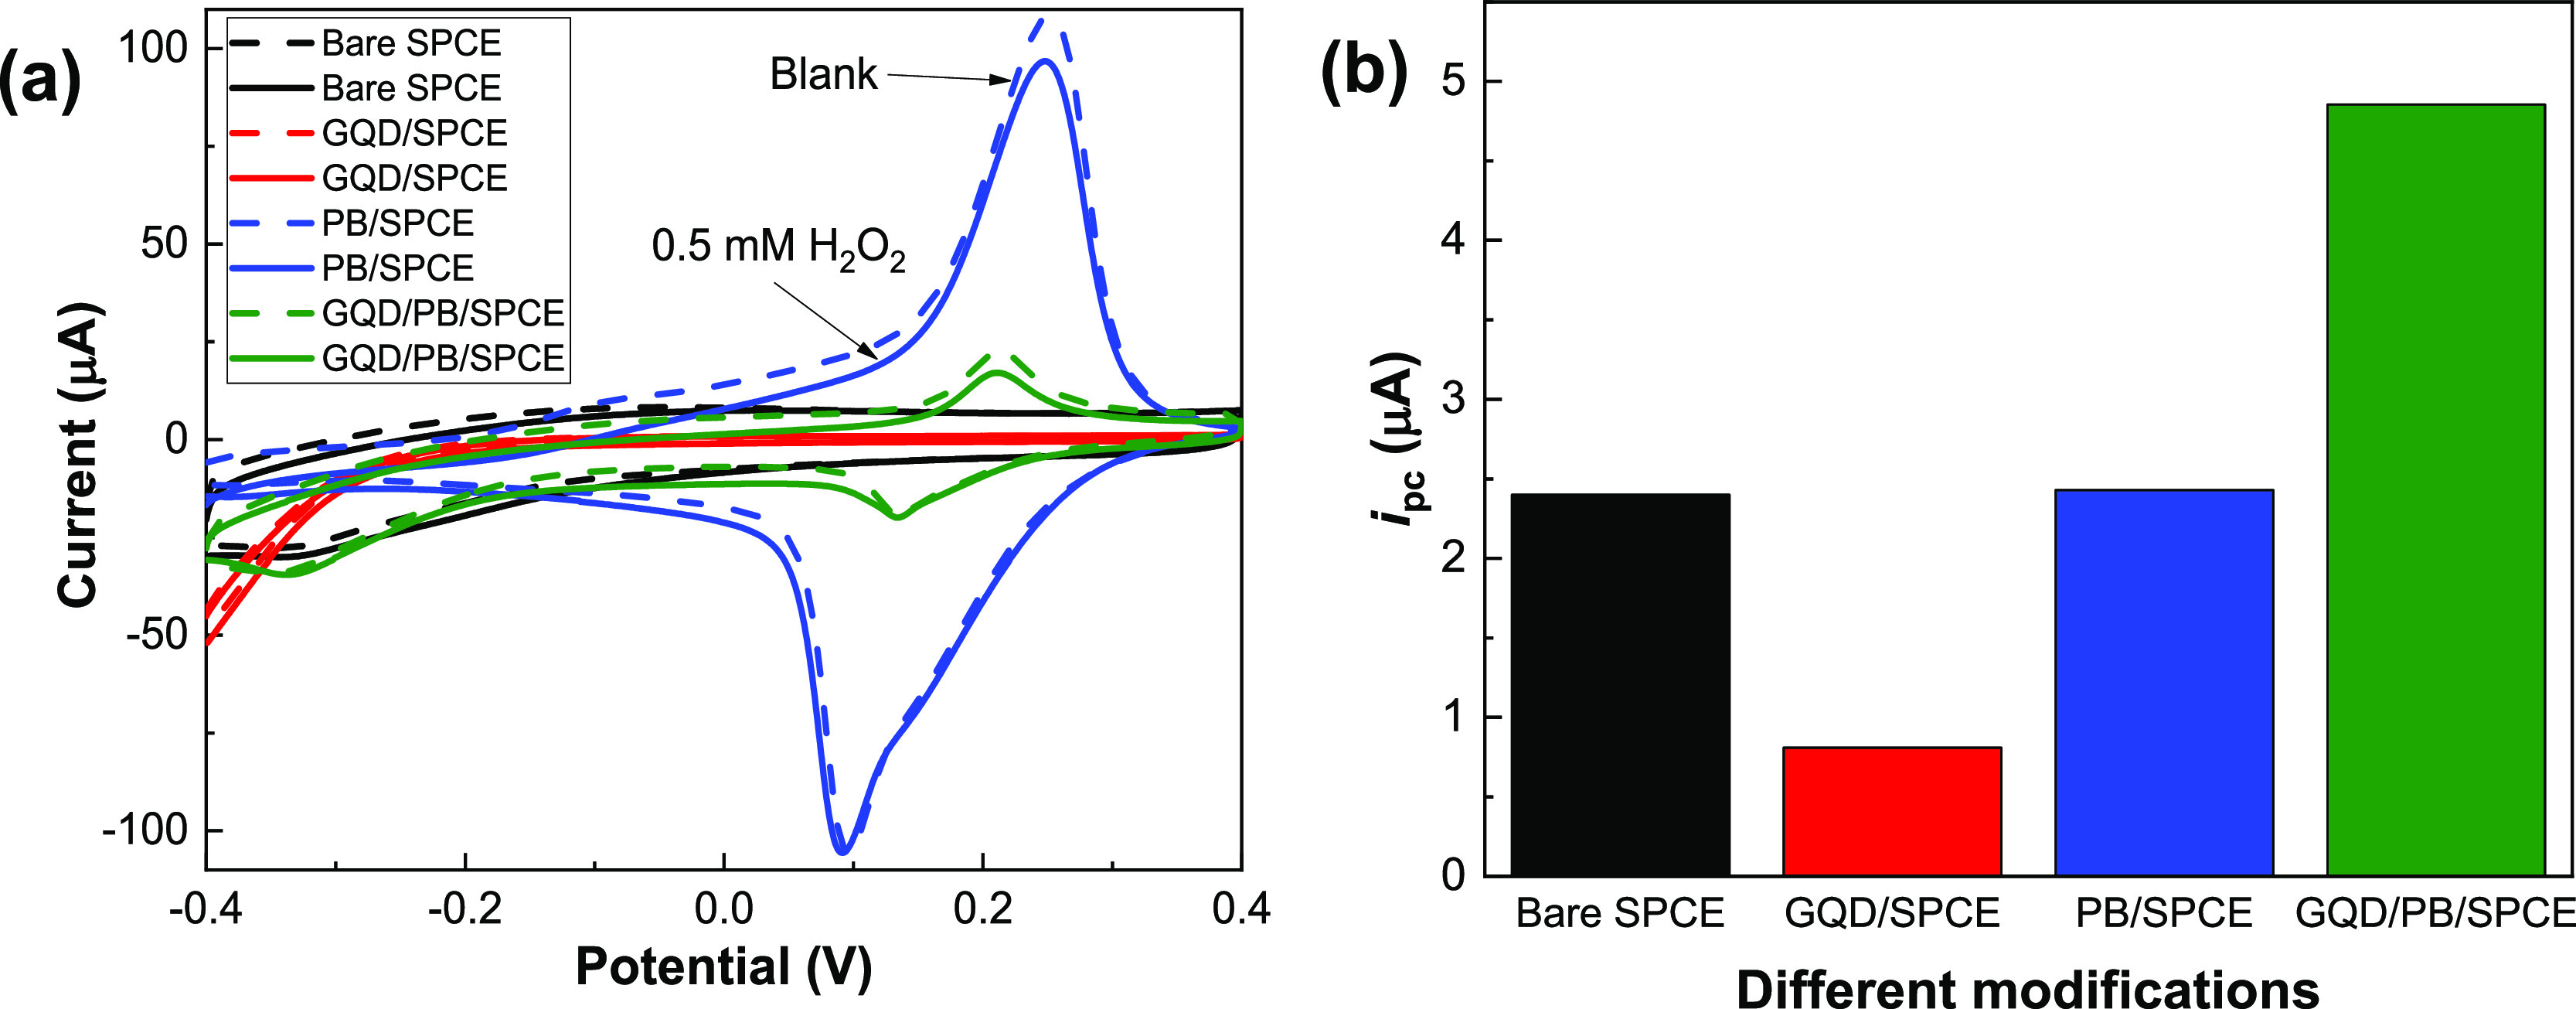
(a) Cyclic voltammograms of the bare SPCE, GQD/SPCE, PB/SPCE, and GQD/PB/SPCE in N2-saturated 50 mM PBS (pH 7.0) without (dash line) and with (solid line) 0.5 mM H2O2 at a scan rate of 10 mV s–1 and (b) corresponding plot of ipc values measured at −0.10 V for the electrodes with different modifications.
2.3. Optimization of Sensor Performance
To optimize the applied potential, the amperometric measurements were repeated with 0.10 mM H2O2 on the differently modified electrodes at several applied potentials from 0.0 to −0.20 V. The results (Figure 3a) show that for each electrode, the cathodic current response to H2O2 reduction increased in the studied potential range under a more negative applied potential. However, to minimize possible interferences, a potential of −0.10 V was chosen for subsequent experiments.
Figure 3.
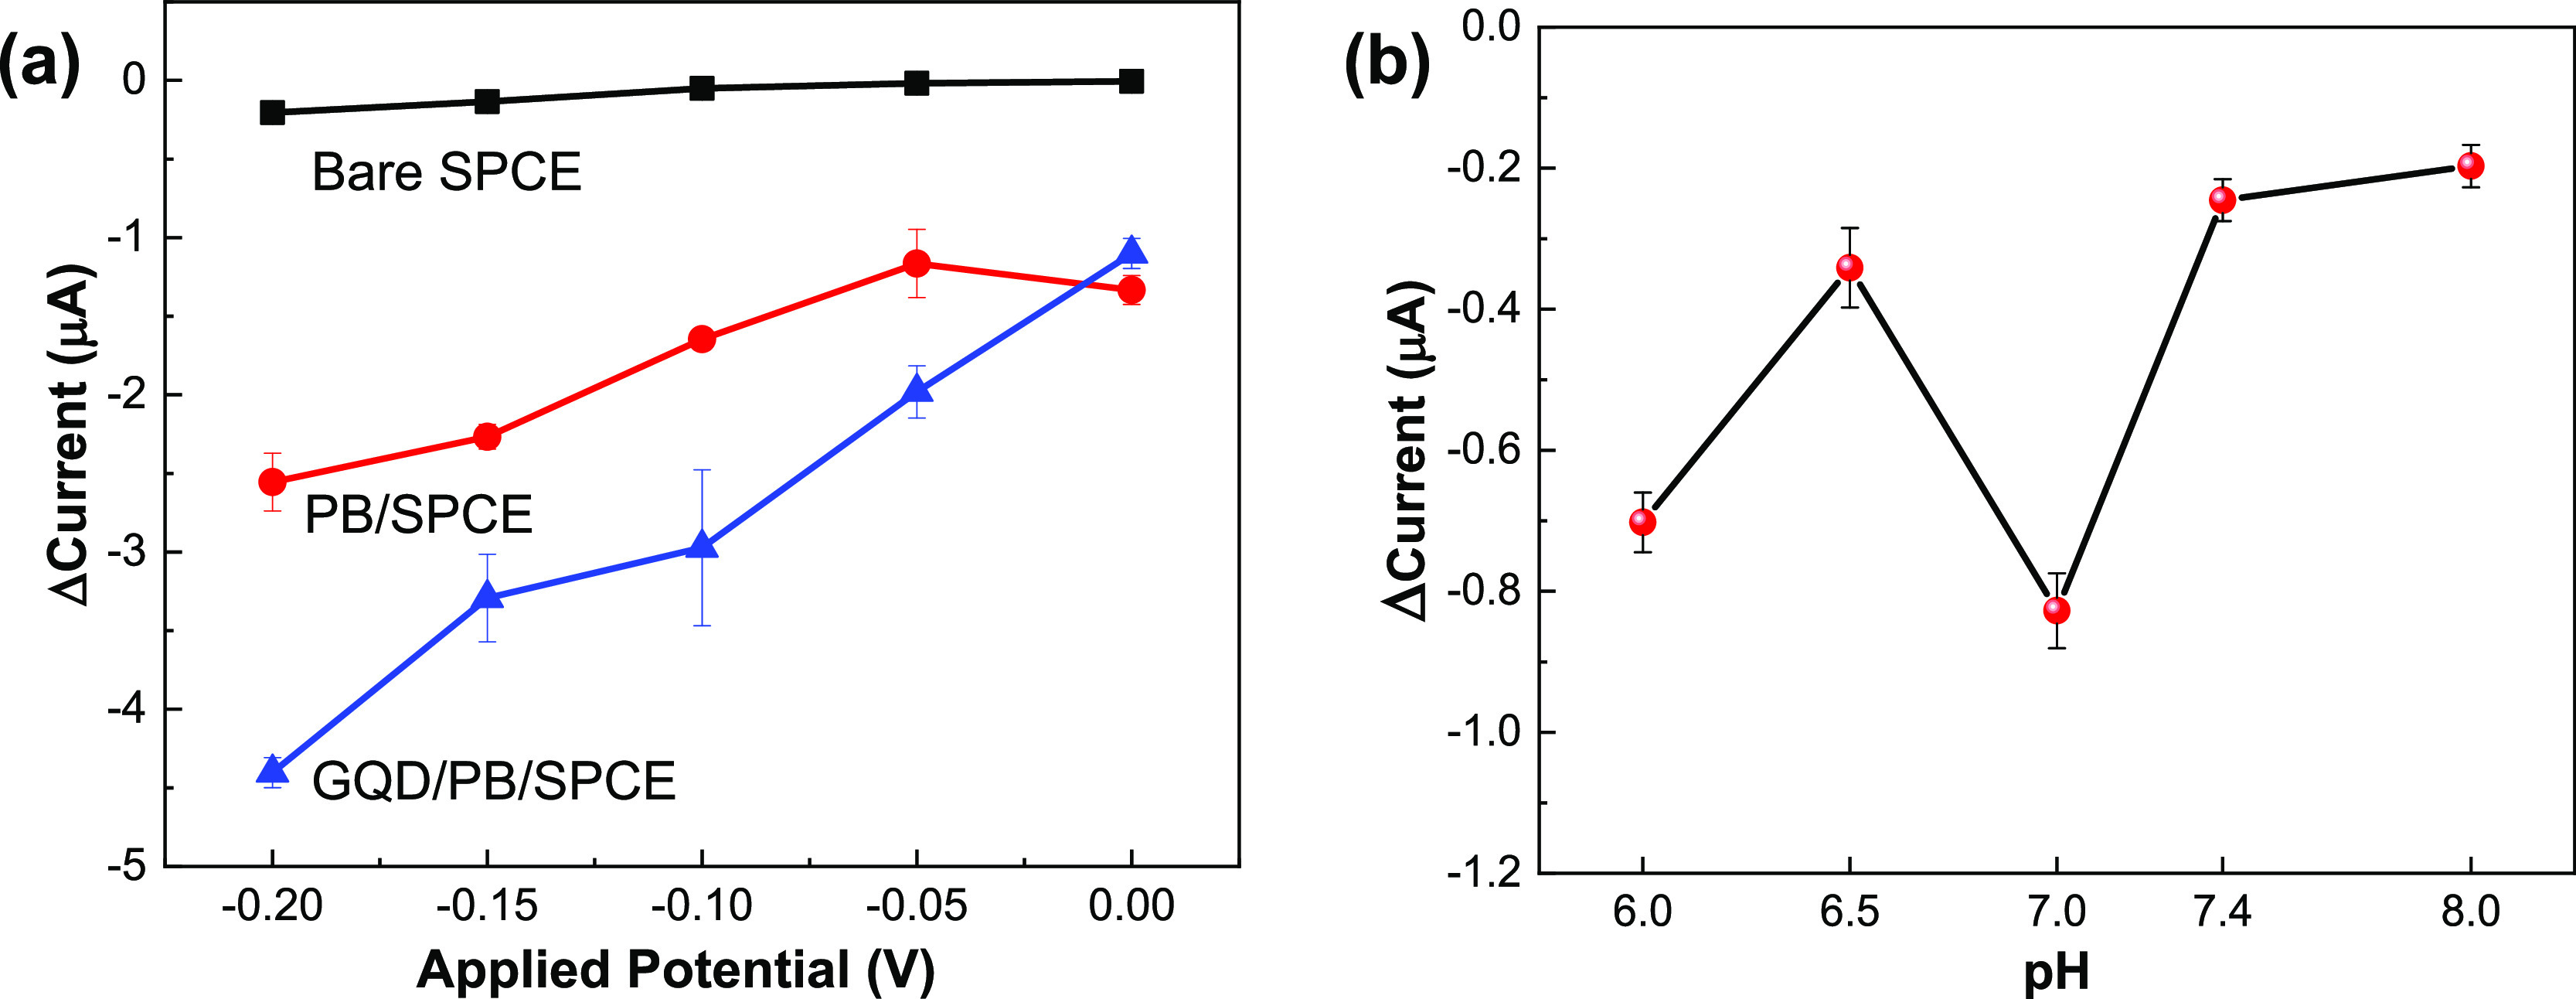
(a) Current change under different applied potentials for the bare SPCE, PB/SPCE, and GQD/PB/SPCE in 50 mM PBS (pH 7.0) containing 0.1 mM H2O2. (b) Current change under different pH values for PoxBNP/PB/SPCE in 50 mM PBS containing 0.25 mM Py at an applied potential of −0.1 V.
The effect of solution pH on the PoxBNP/PB/SPCE was evaluated via amperometric measurements in 0.25 mM Py and 50 mM PBS at pH 6.0–8.0 (Figure 3b). After the addition of Py, the maximum amperometric response was obtained at pH 7.0 and this was chosen as the operating pH for the subsequent experiments.
Amperometric measurements were also used to assess the electrochemical behavior of PoxB on different electrodes. Figure 4a shows the amperometric responses of the PoxB/SPCE, PoxBNP/SPCE, PoxB/PB/SPCE, and PoxBNP/PB/SPCE recorded in 50 mM PBS (pH 7.0) in the absence and presence of 0.50 mM Py at an applied potential of −0.10 V. No detectable current response was observed for the PoxB/SPCE, PoxBNP/SPCE, and PoxB/PB/SPCE either with or without Py. Only the PoxBNP/PB/SPCE showed a clear reduction in the current response. In this case, the GQDs had an important synergic effect with PB, leading to fast electron transfer on PoxB at the electrode surface.
Figure 4.
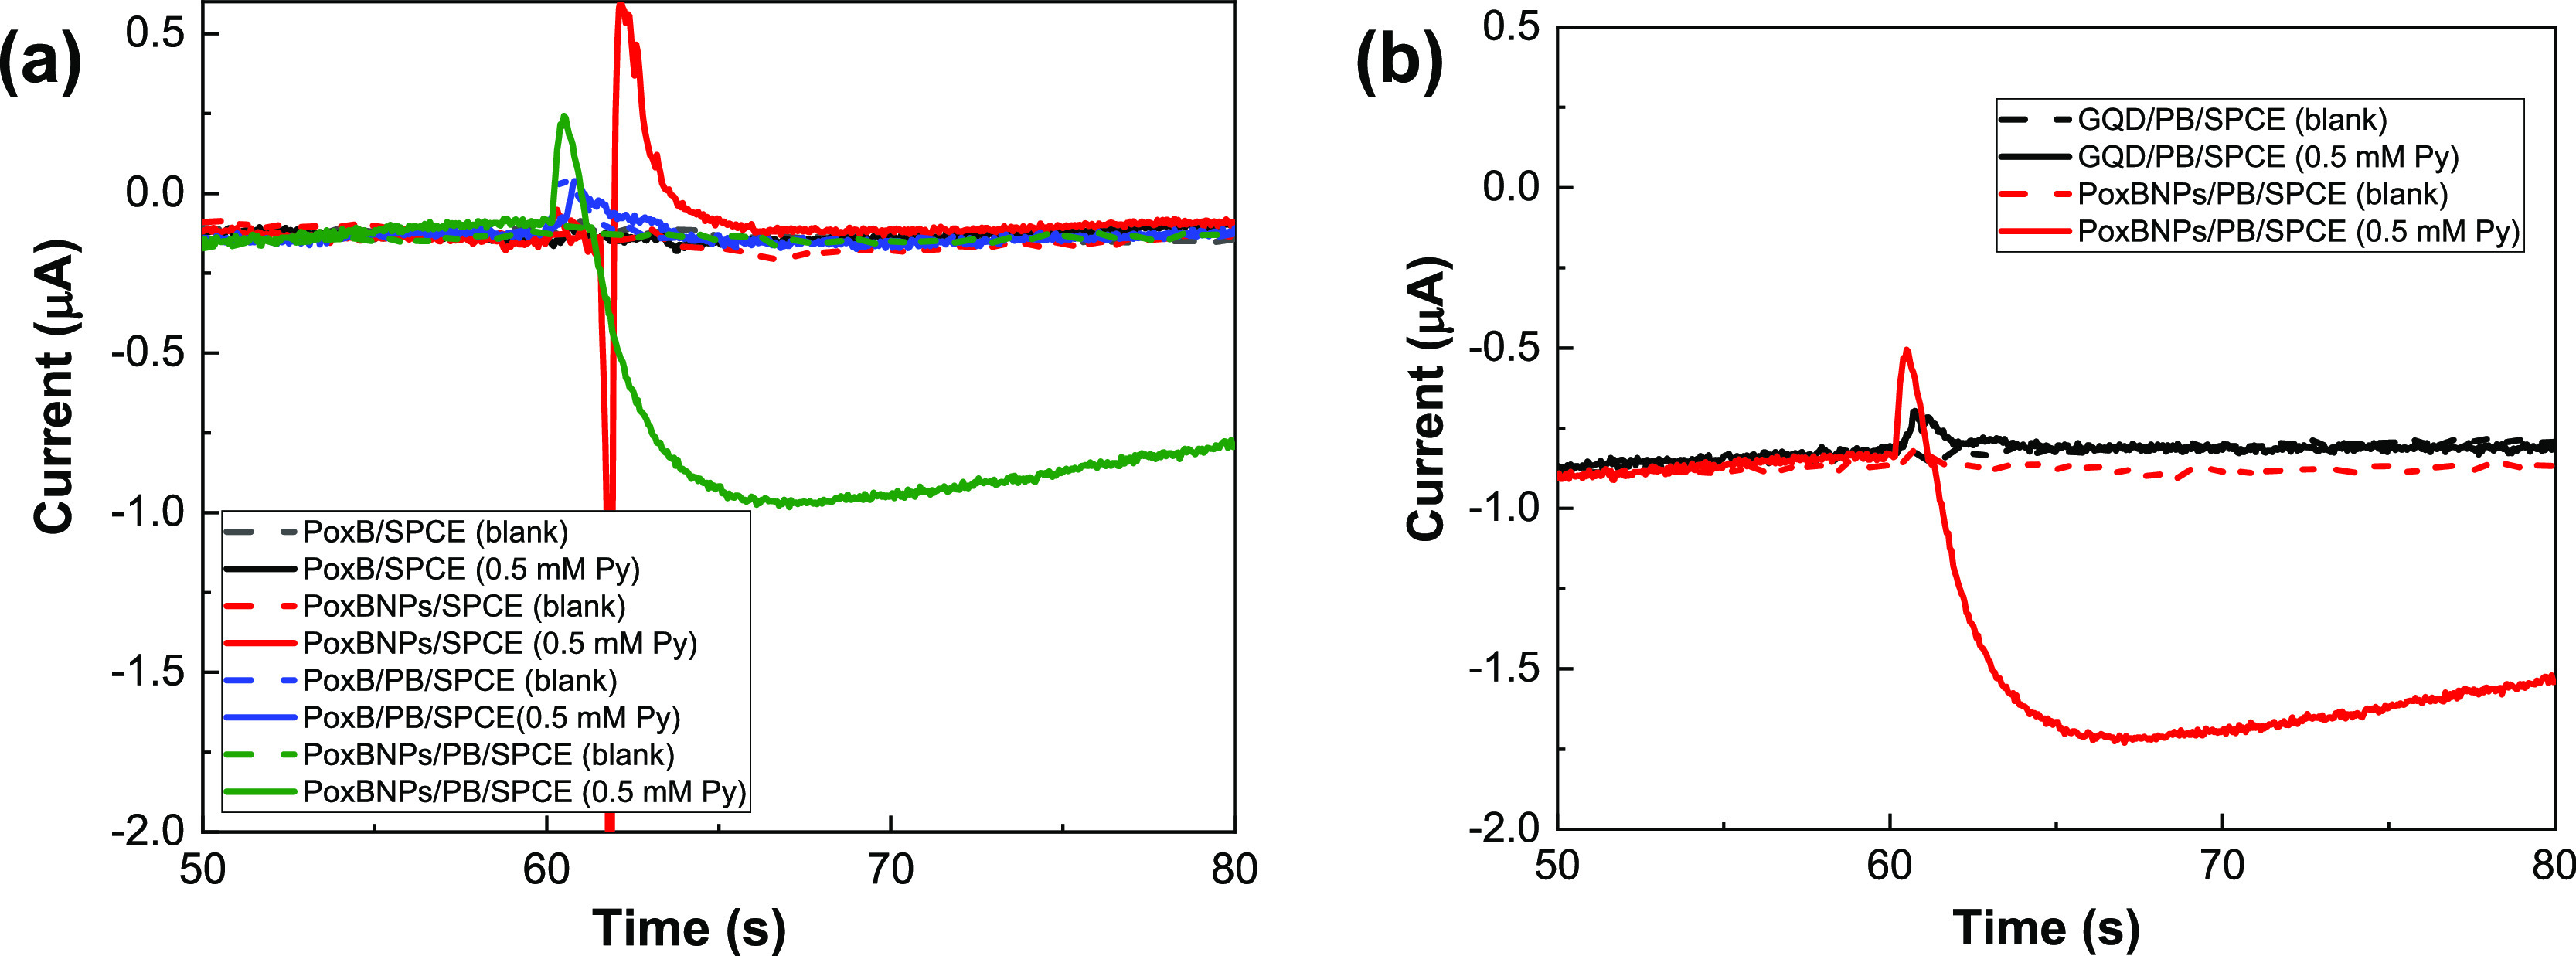
Amperometric responses of (a) PoxB/SPCE, PoxBNP/SPCE, PoxB/PB/SPCE, and PoxBNP/PB/SPCE; (b) GQD/PB/SPCE and PoxBNP/PB/SPCE in 50 mM PBS (pH 7.0) without (dash line) and with (solid line) 0.5 mM Py at an applied potential of −0.1 V.
Figure 4b compares the amperometric responses of the GQD/PB/SPCE without and with immobilized PoxB, recorded in 50 mM PBS (pH 7.0) in the absence and presence of 0.5 mM Py at an applied potential of −0.10 V. When there was no immobilized enzyme, there was no distinguishable current response between the cases with and without Py. In contrast, the PoxB-immobilized GQD/PB/SPCE showed a distinguishable current response after adding Py to the PBS. This confirms the effective physical adsorption of PoxB on the GQD/PB/SPCE surface.
2.4. Calibration Curve for Py
To construct a calibration curve for Py, amperometric measurements were performed for the PoxBNP/PB/SPCE with different concentrations of Py. Figure 5a shows the representative amperometric responses under the optimized experimental conditions. The current responses achieved maximum values in less than 5 s, and each current response was measured for 20 s after the addition of Py samples. Figure 5b shows the constructed Py calibration curve using the PoxBNP/PB/SPCE, in which the error bars represent the standard deviation over three measurements. The regression line was calculated to be i (μA) = 0.00512CPy (μM) – 0.0909 (R2 = 0.9865). From the calibration curve, the biosensor’s sensitivity was calculated to be 40.8 μA mM–1 cm–2, and the dynamic linear range was from 10 to 100 μM. The limit of detection (LOD) of the biosensor was taken as five times the standard deviation of the current change because of the addition of a blank solution, and its value was 0.91 μM (S/N = 3). Table S1 compares the results obtained here to those of previously reported amperometric biosensor systems. The LOD in this work is similar to that in other studies, but the sensitivity is relatively higher. Moreover, the present reagentless fabrication method is more suitable for real sample analysis, and there is also less interference within the working potential in our system.
Figure 5.
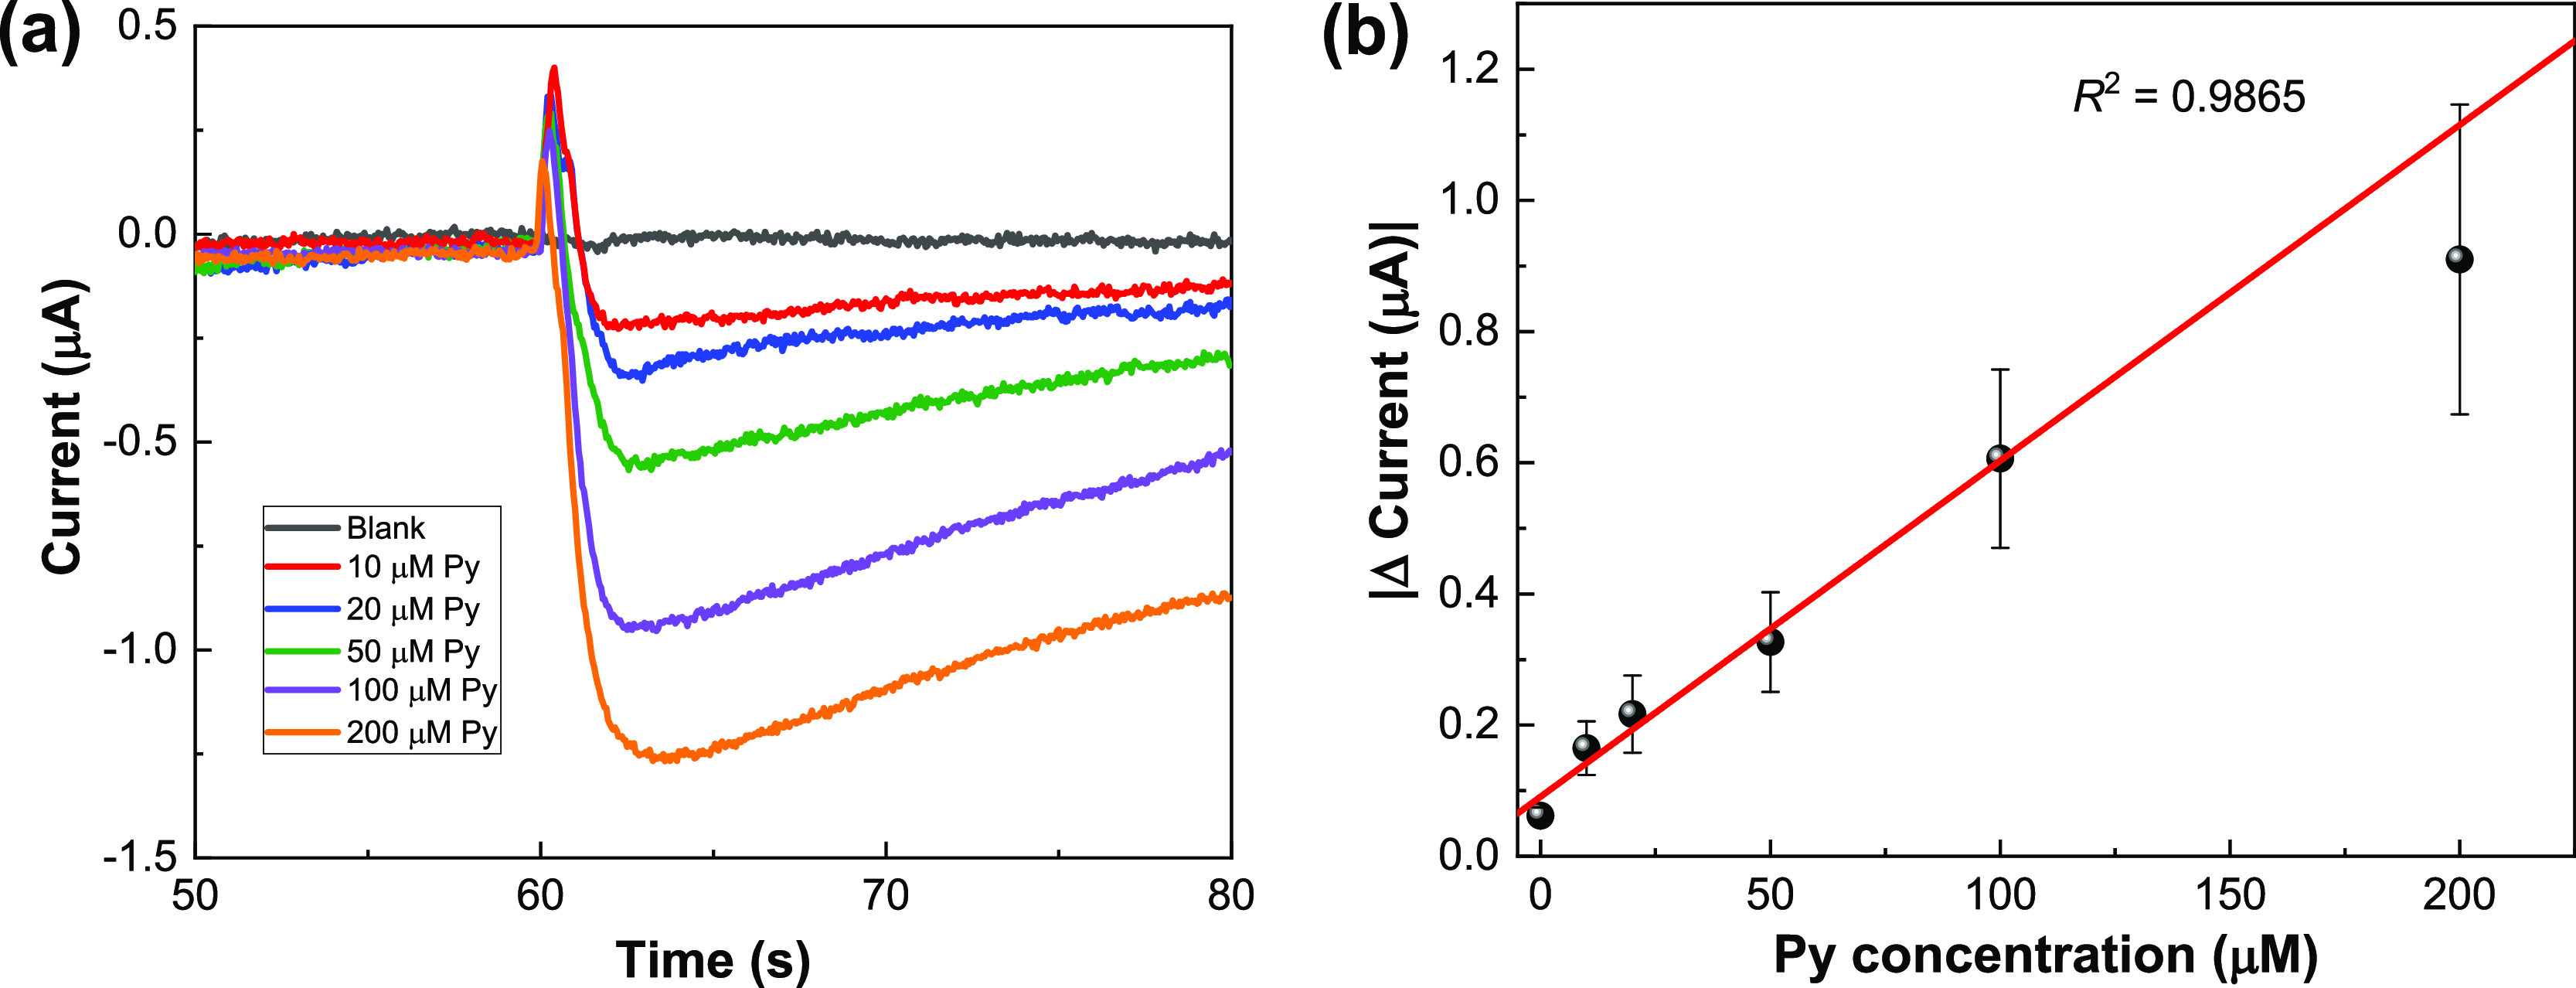
(a) Representative amperometric responses of the PoxBNP/PB/SPCE with successive addition of Py to 50 mM PBS (pH 7.0) at an applied potential of −0.1 V. (b) Calibration plot obtained from (a).
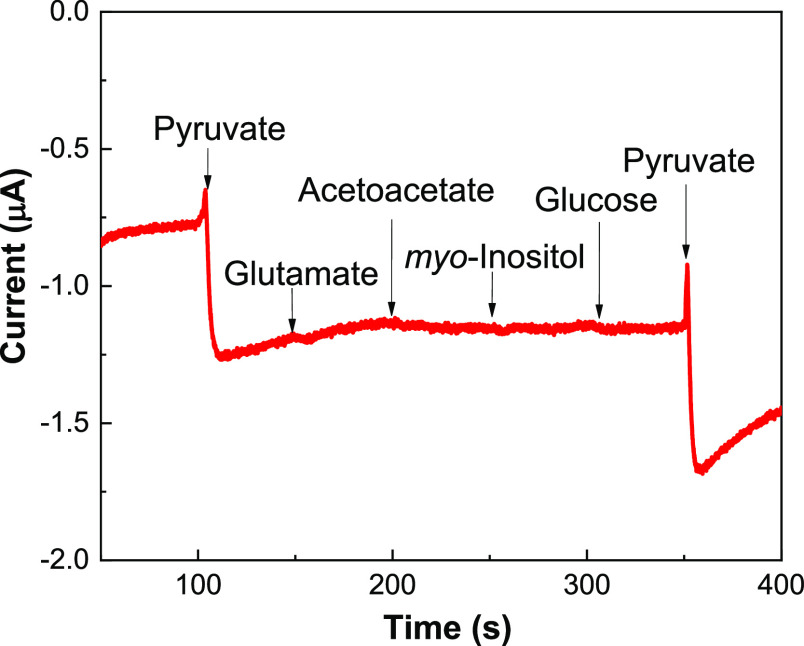
The amperometric selectivity in Py detection is often compromised by other coexisting metabolites, such as glutamate, acetoacetate, myo-inositol, and glucose. This is a significant challenge for the selective detection of Py in gross biological samples. Therefore, we investigated the possible effects of interfering species on Py sensing using the PoxBNP/PB/SPCE (Figure 6). Successive addition of glutamate, acetoacetate, myo-inositol, and glucose (all at 1.0 mM) was performed, which is two times higher than the Py concentration. The current responses from the interfering species were negligible at the optimized applied potential of −0.10 V. These findings demonstrate that the proposed biosensor could effectively discriminate Py in real samples.
Figure 6.
Amperometric response of the PoxBNP/PB/SPCE in 50 mM PBS (pH 7.0) at an applied potential of −0.1 V, with successive additions of 0.5 mM Py, 1.0 mM glutamate, 1.0 mM acetoacetate, 1.0 mM myo-inositol, 1.0 mM glucose, and 0.5 mM Py.
Next, five identical PoxBNP/PB/SPCEs were prepared, and the electrode-to-electrode reproducibility was measured using 100 μM Py. The relative standard deviation (RSD) was calculated to be 16%. To evaluate the stability of the PoxBNP/PB/SPCEs, they were stored for one week under ambient conditions. Afterward, the amperometric response was 62% of that exhibited by the electrode stored in a refrigerator. Hence, the fabricated biosensor has good reproducibility and stability for Py detection.
2.5. Analysis of Real Fish Serum Samples
The practical applicability of the as-prepared biosensor was tested by measuring the Py concentration in fish serum samples using the standard addition method. The amperometric measurement was as described above using the constructed calibration curve, except that the Py solution was replaced by spiked fish serum. The Py concentrations in the same fish serum samples were also determined by 1H NMR, which is a standard analytical technique used to measure Py concentrations in real serum samples. Therefore, we used the comparison of our proposed biosensor results. In the NMR spectra (Figure S5), the singlet peak of Py at 2.38 ppm increased in intensity when more Py was spiked into the serum. The Py concentrations measured using the proposed biosensor and NMR methods are in good agreement with each other. To obtain the raw serum Py concentration, the spiked sample results were multiplied by the dilution factor (1.25). These values are also compared to the Py concentrations measured by the standard colorimetric method using the pyruvate assay kit (Table 1). The recovery for our proposed biosensor was 115.8% and that for the NMR method was 90.4%; this confirms the practical applicability of the designed biosensor for real sample analysis.
Table 1. Comparison of Py Concentrations Measured in Fish Serum Samplesa.
| methods | added (μM) | found (μM) | ±SD (μM) | recovery (%) | RSD (%) |
|---|---|---|---|---|---|
| proposed biosensor | unknown | 327.3 | 44.04 | 13.5 | |
| 10.0 | 370.4 | 27.91 | 109.8 | 7.5 | |
| 50.0 | 399.5 | 35.60 | 105.9 | 8.9 | |
| 100 | 471.5 | 14.78 | 110.3 | 3.1 | |
| NMR | unknown | 255.6 | 3.738 | 1.46 | |
| 10.0 | 290.9 | 29.81 | 109.5 | 10.2 | |
| 50.0 | 352.3 | 30.38 | 115.3 | 8.62 | |
| 100 | 387.9 | 5.295 | 109.1 | 1.37 | |
| pyruvate assay kit | raw serum | 353.3 | |||
| proposed biosensor | 409.1 | 115.8 | |||
| NMR | 319.5 | 90.4 |
SD: standard deviation. RSD: relative standard deviation.
3. Conclusions
A reagentless amperometric pyruvate biosensor based on PB and an EnNP-modified SPCE was developed. The synergic effect of GQDs and PB enhances fast electron transfer on PoxB at the electrode surface. This biosensor is simple but very effective for selective Py detection, with a dynamic linear range from 10 to 100 μM, a sensitivity of 40.8 μA mM–1 cm–2, and a sufficiently low LOD of 0.91 μM. Furthermore, the developed Py biosensor showed strong anti-inference capability, better stability, and reproducibility. Therefore, the PoxBNP/PB/SPCE may be an ideal candidate for new enzyme-based biosensors, particularly for Py detection in fish samples.
4. Experimental Section
4.1. Materials
Pyruvate oxidase (PoxB, EC: 1.2.3.3) from microorganisms, sodium pyruvate (Py), glutaraldehyde (GA, 25% in H2O), Nafion (5 wt %), GQDs (cat. no. 900713, less than 5 nm in diameter), sodium phosphate monobasic (NaH2PO4), sodium phosphate dibasic (Na2HPO4), potassium chloride (KCl), potassium ferricyanide (K3[Fe(CN)6]), iron (III) chloride (FeCl3), magnesium nitrate (Mg(NO3)2), deuterated water (D2O), and N,N-dimethylglycine (DMG, C4H9NO2) were purchased from Sigma-Aldrich (USA). TPP was purchased from Koram Biotech Corporation (South Korea). All other reagents were of analytical grade and used without further purification. The pH optimization experiment used phosphate-buffered solutions (PBS, 50 mM) at different pH values, which were prepared by mixing NaH2PO4 with Na2HPO4 and 100 mM KCl. All aqueous solutions were prepared using deionized water (Milli-Q water purifying system, 18 MΩ cm).
4.2. Electrodeposition of PB Nanoparticles
To develop the pyruvate biosensor, first, the SPCE (4 mm diameter; model C110, DropSens) was pretreated to remove the organic contaminants or constituents and increase its surface functionality. Briefly, the SPCE was dipped in 0.1 M PBS (pH 7.0), and the potential was cycled from −0.6 to +1.6 V at a scan rate of 100 mV s–1 for 40 cycles.22 After pretreatment, PB was electrodeposited on the SPCE. To fabricate the PB film, the SPCE was immersed in a solution containing 5 mM K3[Fe(CN)6] and 5 mM FeCl3. The supporting electrolyte was 0.1 M KCl with 0.1 M HCl. The electrodeposition was performed by applying a constant potential of +0.4 V for 60 s. The deposited PB films were washed with deionized water to remove the free PB and then activated in the same supporting electrolyte solution by cycling the applied potential in the range of −0.05 to 0.35 V at a scan rate of 50 mV s–1.23 The electrode after the PB deposition and activation steps was denoted as PB/SPCE.
4.3. Preparation of PoxBNPs
GQDs (2.0 mg mL–1) were dispersed in distilled water by ultrasonication for 30 min and then mixed with the cofactors (8 mM TPP and 80 mM Mg2+) and 1.0% Nafion. First, 3 μL of this solution was dropped onto the PB/SPCE surface, and then, 3 μL of the enzyme (100 U PoxB) was also carefully dropped. To enhance enzyme immobilization within the GQD matrix, the PoxB solution was enriched with 0.50% GA. The electrode (named as the PoxBNP/PB/SPCE) was dried overnight at 4 °C and the electrodes were gently washed with 50 mM PBS (pH 7.0) to remove the unbound PoxBNPs.
4.4. Apparatus and Measurements
The morphology of the electrodes was investigated via a field emission scanning electron microscope (Zeiss SUPRA 25) with energy-dispersive X-ray spectroscopy (EDS). Chronoamperometric measurements were performed on an electrochemical workstation (Compactstat, Ivium Technologies, USA). Cyclic voltammetry (CV) measurements were carried out with a potentiostat (CH Instruments USA, model 604E).
An electrochemical cell was set up using a 2 mL disposable well with the biosensor for the CV experiments. The biosensor was immersed in 2 mL of PBS (50 mM) that was saturated with N2 gas for 10 min. Cyclic voltammograms were obtained by scanning from −0.4 to +0.4 V at a scan rate of 10 mV s–1. For chronoamperometric measurements, the biosensor was inserted into the electrode holder and connected to a potentiostat. A 60 μL aliquot of PBS (50 mM) was placed on the electrode, which was then polarized at a potential of −0.10 V. After achieving a stable baseline response with the PBS, a total of 20 μL of standard Py solution was added to the electrode, and the current responses were recorded as a function of time. The measurements were repeated several times using different Py concentrations to construct the calibration curves.
4.5. Preparation of Real Fish Serum Samples
Olive flounder (Paralichthys olivaceus) serum samples were collected from healthy individuals and pooled to obtain the required volume for our experiments. The animal protocol was reviewed and approved by the Pusan National University-Institutional Animal Care and Use Committee (PNU-IACUC; approval number: PNU-2019-2473).
In order to minimize the matrix effect of the serum samples, various dilutions of the serum samples were prepared and analyzed. The diluted serum with minimal interferences was chosen, and the samples were prepared as follows: the fish serum samples (4 × 600 μL) were spiked by adding 150 μL of known concentrations of Py (0.0, 10, 50, and 100 μM) and then used for the real sample analysis. The dilution factor for the spiked sample is 1.25. The total Py concentrations in the spiked serum samples were determined following the same chronoamperometric measurement described above, based on the linear calibration plot.
For comparison, Py in the spiked fish serum samples was also measured via1H NMR using a 600 MHz HR-MAS NMR spectrometer with a nano-NMR probe (Agilent Technologies, Santa Clara, CA, USA). The spiked fish serum (36 μL) and phosphate buffer (pH 7.4, 4 μL) in D2O containing 20 mM DMG as an internal reference were transferred to a 4 mm NMR nanotube. The spinning rate was 2050 Hz with a temperature of 24.85 °C (298 K). The Carr–Purcell–Meiboom–Gill (CPMG) pulse sequence was used to suppress high-molecular weight compounds. The acquisition time was 1.703 s, the relaxation delay was 1 s, and a total of 128 transients were collected. All spectra were analyzed using Chenomx NMR Suite 7.1 Professional (Chenomx Inc., Canada) for the identification and quantification of Py. The final concentration of the reference material in the sample was 2 mM. The concentrations of Py were calculated based on the peak integrals of the reference material.
The Py concentration in the fish serum was also determined using a colorimetric pyruvate assay kit (cat. no. ab65342; Abcam) according to the manufacturer’s protocol.
Acknowledgments
This work was supported by the National Research Foundation of Korea (NRF) grant funded by the Korea government (MSIT) (no. NRF-2019R1F1A1063034) and the BK21 Plus program through the NRF funded by the Ministry of Education (no. 10Z20130000004). This study was part of the project titled “Omics based on fishery disease control, technology development, and industrialization (20150242),” funded by the Ministry of Oceans and Fisheries, Korea.
Supporting Information Available
The Supporting Information is available free of charge at https://pubs.acs.org/doi/10.1021/acsomega.0c04522.
EDS spectrum analysis data, EDS elemental mapping, comparison of amperometric Py biosensors, and 1H NMR spectrum of the spiking experiment (PDF)
The authors declare no competing financial interest.
Supplementary Material
References
- Low C.-F.; Rozaini M. Z. H.; Musa N.; Syarul Nataqain B. Current knowledge of metabolomic approach in infectious fish disease studies. J. Fish Dis. 2017, 40, 1267–1277. 10.1111/jfd.12610. [DOI] [PubMed] [Google Scholar]
- Ma S.; Kim A.; Lee W.; Kim S.; Lee S.; Yoon D.; Bae J.-S.; Park C.-I.; Kim S. Vibrio harveyi infection significantly alters amino acid and carbohydrate metabolism in whiteleg shrimp, litopenaeus vannamei. Metabolites 2020, 10, 265. 10.3390/metabo10060265. [DOI] [PMC free article] [PubMed] [Google Scholar]
- Nguyen T. V.; Alfaro A. C.; Young T.; Merien F. Tissue-specific immune responses to vibrio sp. infection in mussels (perna canaliculus): a metabolomics approach. Aquaculture 2019, 500, 118–125. 10.1016/j.aquaculture.2018.09.061. [DOI] [Google Scholar]
- Liu P.-F.; Liu Q.-H.; Wu Y.; Jie H. A pilot metabolic profiling study in hepatopancreas of Litopenaeus vannamei with white spot syndrome virus based on 1H NMR spectroscopy. J. Invertebr. Pathol. 2015, 124, 51–56. 10.1016/j.jip.2014.09.008. [DOI] [PubMed] [Google Scholar]
- Guo C.; Huang X.-Y.; Yang M.-J.; Wang S.; Ren S.-T.; Li H.; Peng X.-X. GC/MS-based metabolomics approach to identify biomarkers differentiating survivals from death in crucian carps infected by edwardsiella tarda. Fish Shellfish Immunol. 2014, 39, 215–222. 10.1016/j.fsi.2014.04.017. [DOI] [PubMed] [Google Scholar]
- Wishart D. S. Metabolomics for investigating physiological and pathophysiological processes. Physiol. Rev. 2019, 99, 1819–1875. 10.1152/physrev.00035.2018. [DOI] [PubMed] [Google Scholar]
- Reddy K. K.; Bandal H.; Satyanarayana M.; Goud K. Y.; Gobi K. V.; Jayaramudu T.; Amalraj J.; Kim H. Recent trends in electrochemical sensors for vital biomedical markers using hybrid nanostructured materials. Adv. Sci. 2020, 7, 1902980. 10.1002/advs.201902980. [DOI] [PMC free article] [PubMed] [Google Scholar]
- Broza Y. Y.; Zhou X.; Yuan M.; Qu D.; Zheng Y.; Vishinkin R.; Khatib M.; Wu W.; Haick H. Disease detection with molecular biomarkers: from chemistry of body fluids to nature-inspired chemical sensors. Chem. Rev. 2019, 119, 11761–11817. 10.1021/acs.chemrev.9b00437. [DOI] [PubMed] [Google Scholar]
- Ghica M. E.; Brett C. M. A. Development of novel glucose and pyruvate biosensors at poly(neutral red) modified carbon film electrodes. Application to natural samples. Electroanalysis 2006, 18, 748–756. 10.1002/elan.200503468. [DOI] [Google Scholar]
- Gajovic N.; Habermüller K.; Warsinke A.; Schuhmann W.; Scheller F. W. A pyruvate oxidase electrode based on an electrochemically deposited redox polymer. Electroanalysis 1999, 11, 1377–1383. . [DOI] [Google Scholar]
- Kucherenko I. S.; Topolnikova Y. V.; Soldatkin O. O. Advances in the biosensors for lactate and pyruvate detection for medical applications: A review. Trends Anal. Chem. 2019, 110, 160–172. 10.1016/j.trac.2018.11.004. [DOI] [Google Scholar]
- Malik M.; Chaudhary R.; Pundir C. S. An improved enzyme nanoparticles based amperometric pyruvate biosensor for detection of pyruvate in serum. Enzyme Microb. Technol. 2019, 123, 30–38. 10.1016/j.enzmictec.2019.01.006. [DOI] [PubMed] [Google Scholar]
- Malik M.; Chaudhary R.; Pundir C. S. An amperometric pyruvate biosensor based on pyruvate oxidase nanoparticles immobilized onto pencil graphite electrode. Process Biochem. 2020, 93, 12–20. 10.1016/j.procbio.2020.03.008. [DOI] [Google Scholar]
- Andreyev E. A.; Komkova M. A.; Nikitina V. N.; Zaryanov N. V.; Voronin O. G.; Karyakina E. E.; Yatsimirsky A. K.; Karyakin A. A. Reagentless polyol detection by conductivity increase in the course of self-doping of boronate-substituted polyaniline. Anal. Chem. 2014, 86, 11690–11695. 10.1021/ac5029819. [DOI] [PubMed] [Google Scholar]
- German N.; Kausaite-Minkstimiene A.; Ramanavicius A.; Semashko T.; Mikhailova R.; Ramanaviciene A. The use of different glucose oxidases for the development of an amperometric reagentless glucose biosensor based on gold nanoparticles covered by polypyrrole. Electrochim. Acta 2015, 169, 326–333. 10.1016/j.electacta.2015.04.072. [DOI] [Google Scholar]
- Pilas J.; Selmer T.; Keusgen M.; Schöning M. J. Screen-Printed Carbon Electrodes Modified with Graphene Oxide for the Design of a Reagent-Free NAD+-Dependent Biosensor Array. Anal. Chem. 2019, 91, 15293–15299. 10.1021/acs.analchem.9b04481. [DOI] [PubMed] [Google Scholar]
- Kucherenko I. S.; Soldatkin O. O.; Topolnikova Y. V.; Dzyadevych S. V.; Soldatkin A. P. Novel multiplexed biosensor system for the determination of lactate and pyruvate in blood serum. Electroanalysis 2019, 31, 1608–1614. 10.1002/elan.201900229. [DOI] [Google Scholar]
- Malik M.; Chaudhary R.; Pundir C. S. Construction of an amperometric pyruvate biosensor based on enzyme bound to a nanocomposite and its comparison with enzyme nanoparticles bound to electrode. Int. J. Appl. Sci. Biotechnol. 2019, 7, 195–206. 10.3126/ijasbt.v7i2.24445. [DOI] [Google Scholar]
- Mokrushina A. V.; Heim M.; Karyakina E. E.; Kuhn A.; Karyakin A. A. Enhanced hydrogen peroxide sensing based on prussian blue modified macroporous microelectrodes. Electrochem. Commun. 2013, 29, 78–80. 10.1016/j.elecom.2013.01.004. [DOI] [Google Scholar]
- Komkova M. A.; Karyakina E. E.; Karyakin A. A. Catalytically synthesized prussian blue nanoparticles defeating natural enzyme peroxidase. J. Am. Chem. Soc. 2018, 140, 11302–11307. 10.1021/jacs.8b05223. [DOI] [PubMed] [Google Scholar]
- Lee C.-K.; Au-Duong A.-N.. Enzyme immobilization on nanoparticles: recent applications. In Emerging Areas in Bioengineering; Chang H. N., Ed.; Wiley-VCH: Weinheim, Germany, 2018; pp 67–80. [Google Scholar]
- Karunakaran C.; Bhargava K.; Benjamin R.. Biosensors and bioelectronics; Elsevier: United States, 2015; pp 1–344. [Google Scholar]
- Karyakin A. A.; Karyakina E. E.; Gorton L. Amperometric biosensor for glutamate using Prussian Blue-based “artificial peroxidase” as a transducer for hydrogen peroxide. Anal. Chem. 2000, 72, 1720–1723. 10.1021/ac990801o. [DOI] [PubMed] [Google Scholar]
Associated Data
This section collects any data citations, data availability statements, or supplementary materials included in this article.


