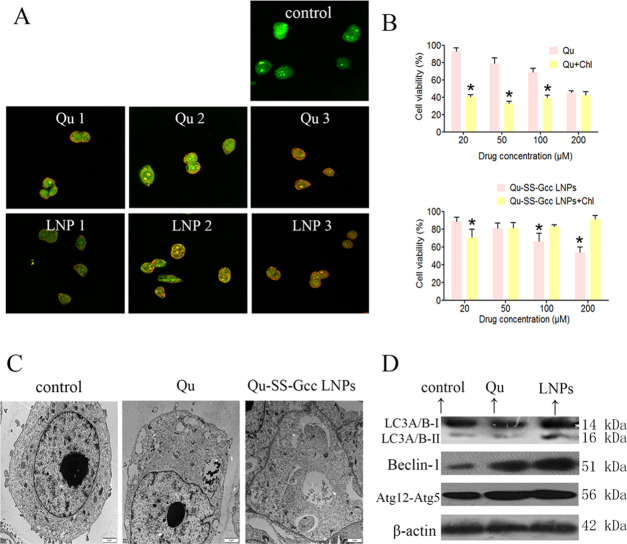
Figure 5.
Qu and Qu-SS-Gcc LNPs induced cell autophagy in MCF-7/ADR cells. (A) Acridine orange staining of MCF-7/ADR cells treated with indicated concentrations of Qu or Qu-SS-Gcc LNPs for 24 h. Qu 1, 2, 3: Qu 25, 50, and 100 μM, respectively; LNPs 1, 2, 3: Qu-SS-Gcc LNPs 25, 50, and 100 μM, respectively. (B) Cell viability assessed by the MTT assay in MCF-7/ADR cells treated with Qu (top) or Qu-SS-Gcc LNPs (bottom) in the absence or presence of Chl (20 μM) for 48 h. (C) Representative TEM images of MCF-7/ADR cells treated with Qu (50 μM) or Qu-SS-Gcc LNPs (50 μM) for 24 h. (D) Immunoblot analysis of autophagy-related proteins. The error bars in the graphs represent the standard deviation (n = 3). Scale bars, 20 μm. *P < 0.05.

