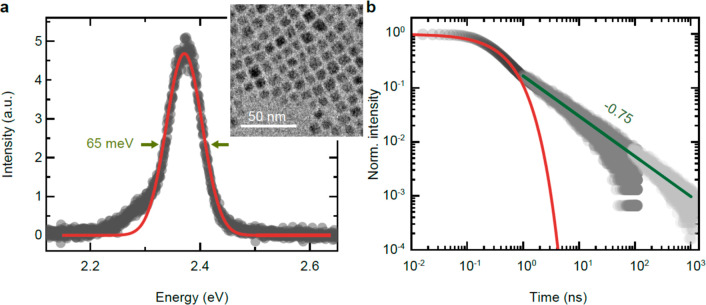
Figure 1.
Photoluminescence emission properties of CsPbBr3 nanocrystals with a size of 6 nm. (a) Photoluminescence spectrum of an ensemble of CsPbBr3 nanocrystals at 5 K. The fwhm of the Gaussian fit (red line) is 65 meV. The inset shows a TEM image of CsPbBr3 NCs. (b) Normalized photoluminescence decay measured over 5 orders of magnitude. The decay trace is stitched together from three different measurements, recorded with different time bins and excited with different repetition rates of 10 MHz, 250 kHz, and 32 kHz for the dark, medium, and light gray decay traces, respectively. The decay trace up to 1 ns is fitted with a single-exponential decay (red curve). We fit the decay from 1 to 100 ns with a power-law-dependent fit (green line).

