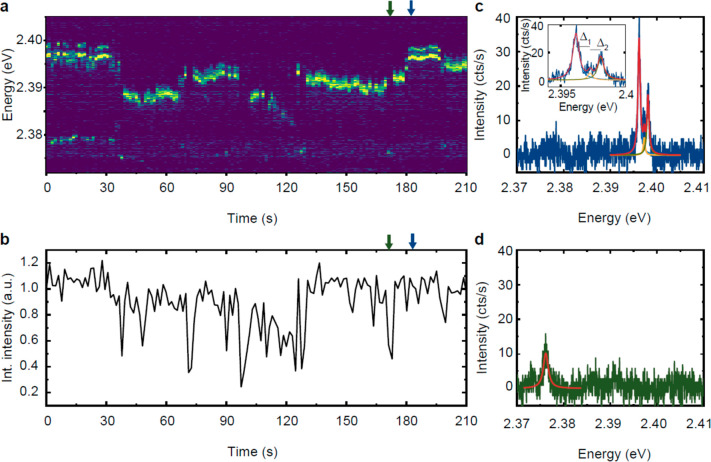
Figure 2.
Emission states of a single CsPbBr3 quantum dot. (a) Time-dependent spectral series of a single CsPbBr3 nanocrystal at 5 K, excited with 0.2 μJ cm–2 and recorded with 1 s integration time. The emission is subject to spectral diffusion. (b) Spectrally integrated intensity of the recorded spectra in (a). (c, d) Photoluminescence spectrum taken from (a) with a high intensity (c), showing an exciton emission peak with fine structure splitting, and a low intensity spectrum (d), showing a trion emission spectrum. Blue and green arrows in (a) and (b) indicate where the high- and low-intensity spectra were taken from, respectively. The emission peaks are fitted with a Lorentzian function (red, green, yellow, and light blue solid line). Inset: Zoom-in to the exciton emission peak with indicated energetic fine structure splitting.

