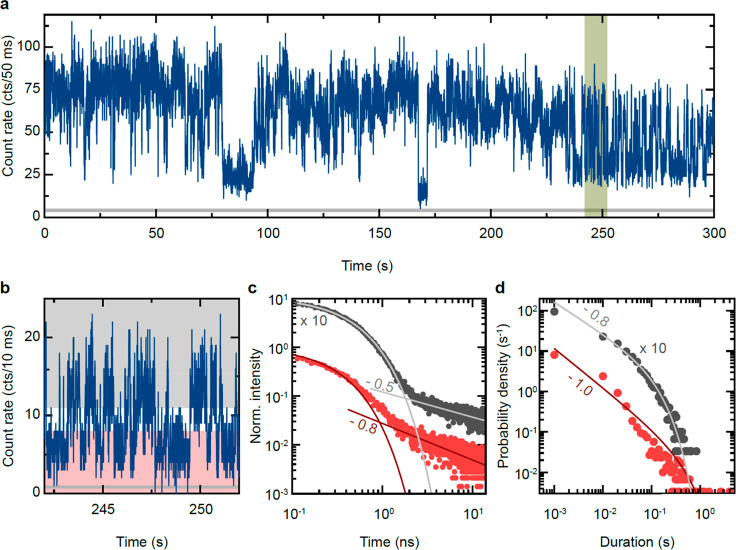
Figure 3.
Fluorescence intermittency of a single CsPbBr3 quantum dot. (a) Intensity trace of the emission intensity from an individual CsPbBr3 quantum dot at cryogenic temperatures with a bin size of 50 ms, revealing strong fluorescence intermittency. The gray horizontal line represents the averaged intensity of the background luminescence. (b) Segment of the intensity trace from (a) binned with 10 ms. Gray- and red-shaded areas represent the intensity ranges used to construct the photoluminescence decay in (c) and the probability distribution in (d). (c) Photoluminescence decay trace of two different intensity levels indicated in (b). The initial exponential decay times are different for the high- and low-intensity levels, known as A-type blinking behavior. In addition, the second decay components that follow a power-law decay show different exponents αX,T. (d) Probability distribution of the duration of high (gray) and low (red) intensity periods of the intensity trace in (a), binned with 10 ms. Solid lines represent fits with a truncated power-law function.

