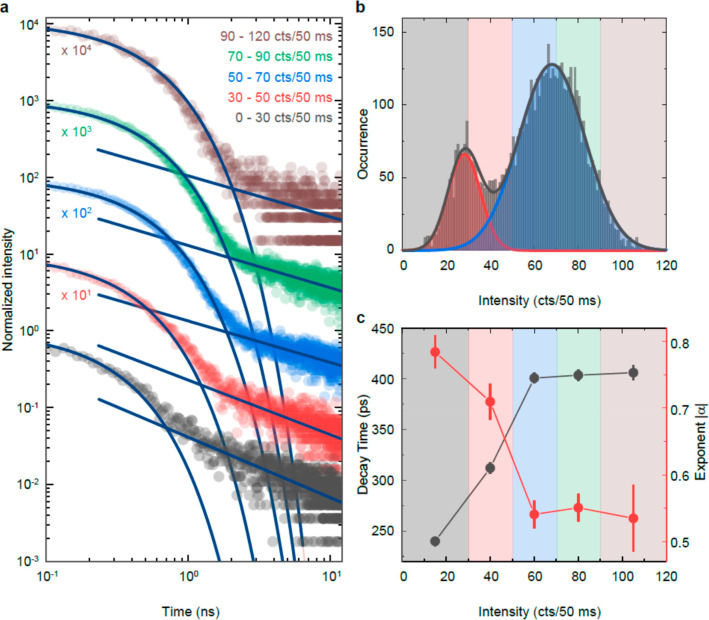
Figure 4.
Intensity-dependent photoluminescence decay. (a) Photoluminescence decays for five different emission intensity ranges as specified in (b). Solid lines are best fits (exponential decay and power-law dependence) to the data. (b) Intensity histogram of the intensity trace in Figure 3a exhibiting two intensity peaks. The intensity ranges used to build intensity-dependent photoluminescence decay traces in (a) are visualized by the color-coded shaded background in the plot. (c) Decay time of the exponential fit and absolute exponent of the power-law fit obtained from (a) as a function of the emission intensity.

