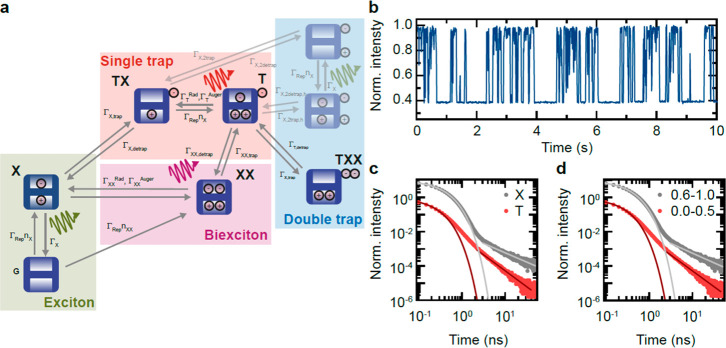
Figure 5.
Monte Carlo simulation: (a) Extended trapping model with corresponding rates. (b) Normalized simulated time trace over 10 s with 10 ms bins. (c) Simulated exciton and trion decays. Both decay traces show a single-exponential decay followed by power-law decay. (d) Extracted decays, binned according to the intensity ranges.

