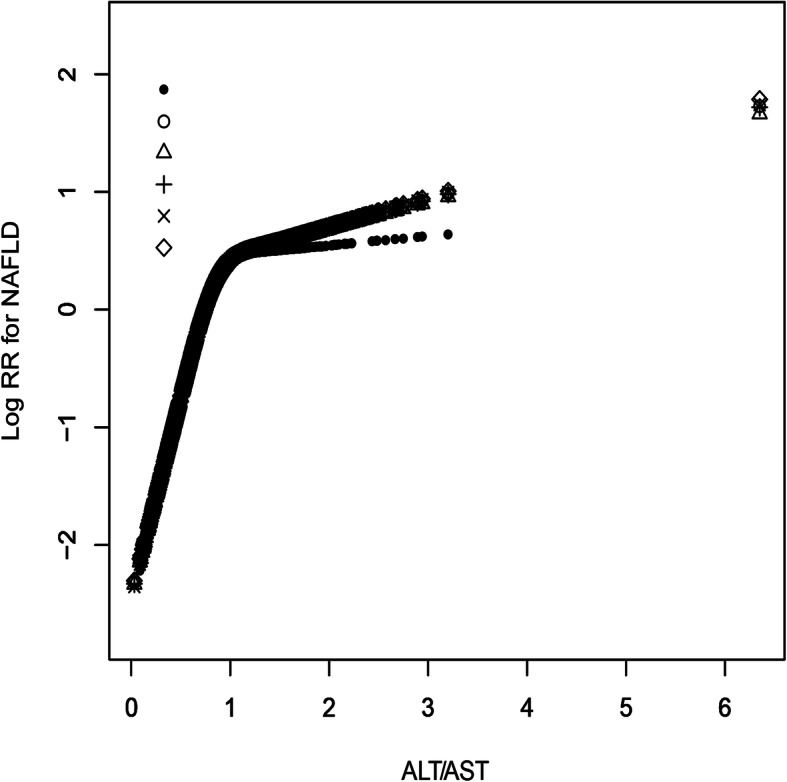
Fig. 1.

The nonlinear association of ALT/AST ratio with the risk of NAFLD (adjusted for sex, age, GGT, ALB, GLB, TB, DBIL, SBP, DBP, ALP, BUN, CR, UA, FPG, TG, HDL-C, LDL-C, Height and BMI). Different line patterns indicated different data sources (pre- or post imputation). Solid point: original data; Hollow point: pro-imputation 1; Triangle: post-imputation 2; Plus sign: post-imputation 3; Multiplication sign: post-imputation 4; Rhombus: post-imputation 5
