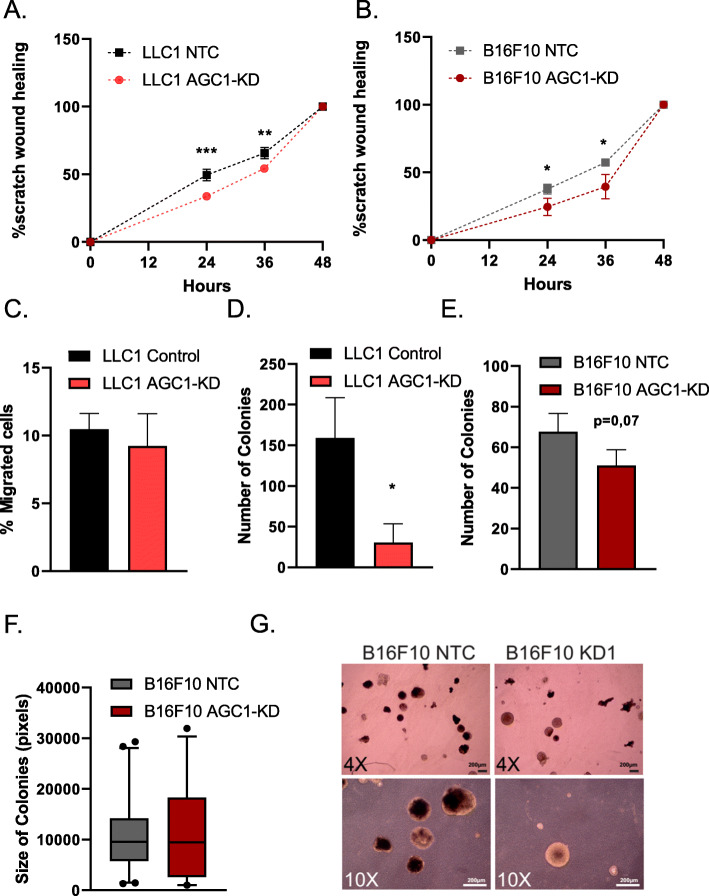
Fig. 4.
AGC1-KD cells do not show signs of increased metastatic ability in cell culture. a, b Percent area covered by control (NTC) and AGC1-KD (a) LLC1 or (b) B16F10 cells over the course of 24, 36, and 48 h following the scratching (n = 5). c Percent of control (NTC) and AGC1-KD cells migrated to the bottom wells of the trans-well after 48 h (n = 3). d–e The number of spheres 14 days after seeding of 2.000 control (NTC) and AGC1-KD LLC1 and B16F10 cells, counted by bright field microscopy (n = 3). f Average colony sizes of B16F10 cells from the sphere formation assay in e. g Representative picture of spheres from B16F10 cells. All experiments denote mean ± SDs. Significance levels: * p ≤ 0.05, ** p ≤ 0.01, *** p ≤ 0.001

