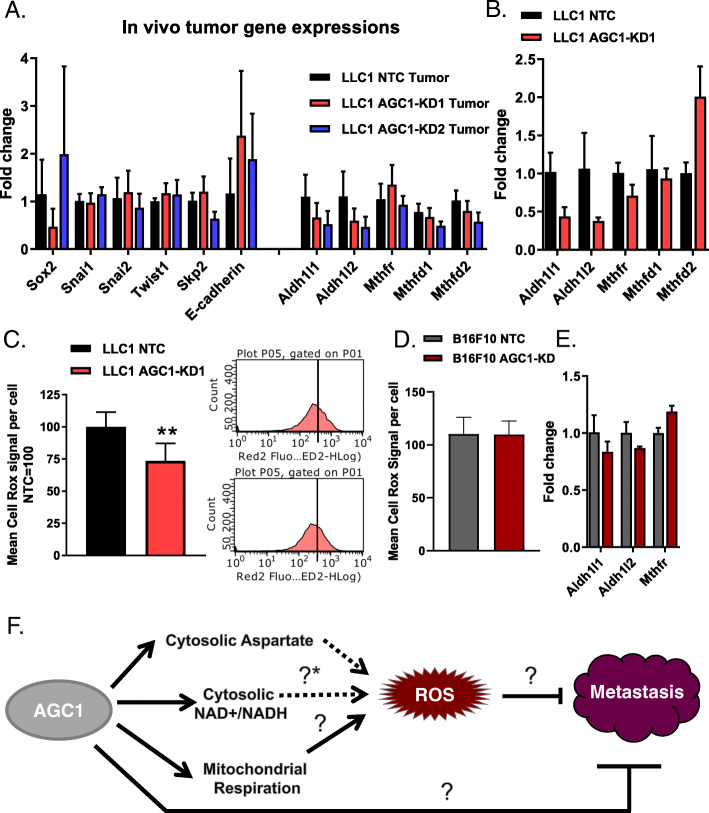
Fig. 5.
AGC1-KD LLC1 cells deregulate folate metabolism (genes) and have lower levels of ROS. a mRNA levels of EMT markers and folate pathway genes in control (NTC), AGC1-KD (KD1, sh911 and KD2, sh908) LLC1 tumors in vivo (n ≥ 6). b mRNA levels of folate pathway genes in control (NTC), AGC1-KD1 LLC1 cells in vitro (n = 3). c (left) Mean CellRox signal per well in AGC1-KD and control (NTC) LLC1 cells; normalized to controls (n = 3). (right) Histograms of one representative well from both control (NTC) and AGC1-KD LLC1 cells showing CellRox signal measured via flow cytometry. d Mean CellRox signal per well in AGC1-KD and control (NTC) B16F10 cells; normalized to controls (n = 3). e mRNA levels of folate pathway genes in control (NTC), AGC1-KD1 B16F10 cells in vitro (n = 3). f Schematic demonstration of potential connections among AGC1 expression, intracellular ROS levels and metastasis. [?*] is referring to the potential changes in folate pathway upon AGC1 expression. All experiments denote mean ± SDs. Significance levels: * p ≤ 0.05, ** p ≤ 0.01, *** p ≤ 0.001

