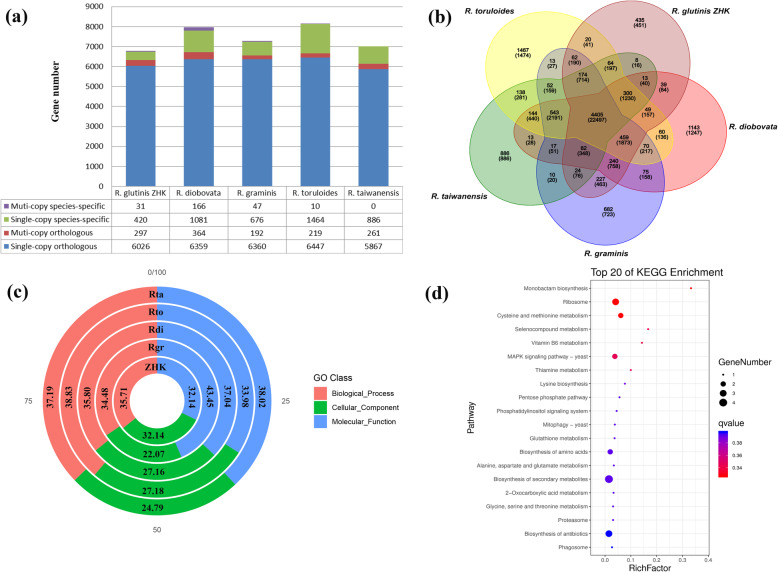
Fig. 5.
Comparative genomic analysis of R. glutinis ZHK with four related species with available genome sequence, namely R. graminis, R. diobovata, R. toruloides and R. taiwanensis. (a) Distribution of single /multi-copy orthologous and species-specific genes among five Rhodotorula species. (b) Venn diagram showing the shared/unique genes in R. glutinis ZHK and comparison with those in R. graminis, R. diobovata, R. toruloides and R. taiwanensis, respectively. (c) Relative proportion (%) of the genes of species-specific protein families enriched to different GO categories, in five genomes of five Rhodotorula species, respectively. (d) Top 20 enriched KEGG pathways of these species-specific genes in R. glutinis ZHK whole genome. Rich factor indicates the ratio of the enriched genes number to the total gene number in a certain pathway. The Q-value results from the p-value via multi-test correction. The ranges of Q-value are from 0 to 1 and a higher enrichment is achieved when the Q-value reaches to 0

