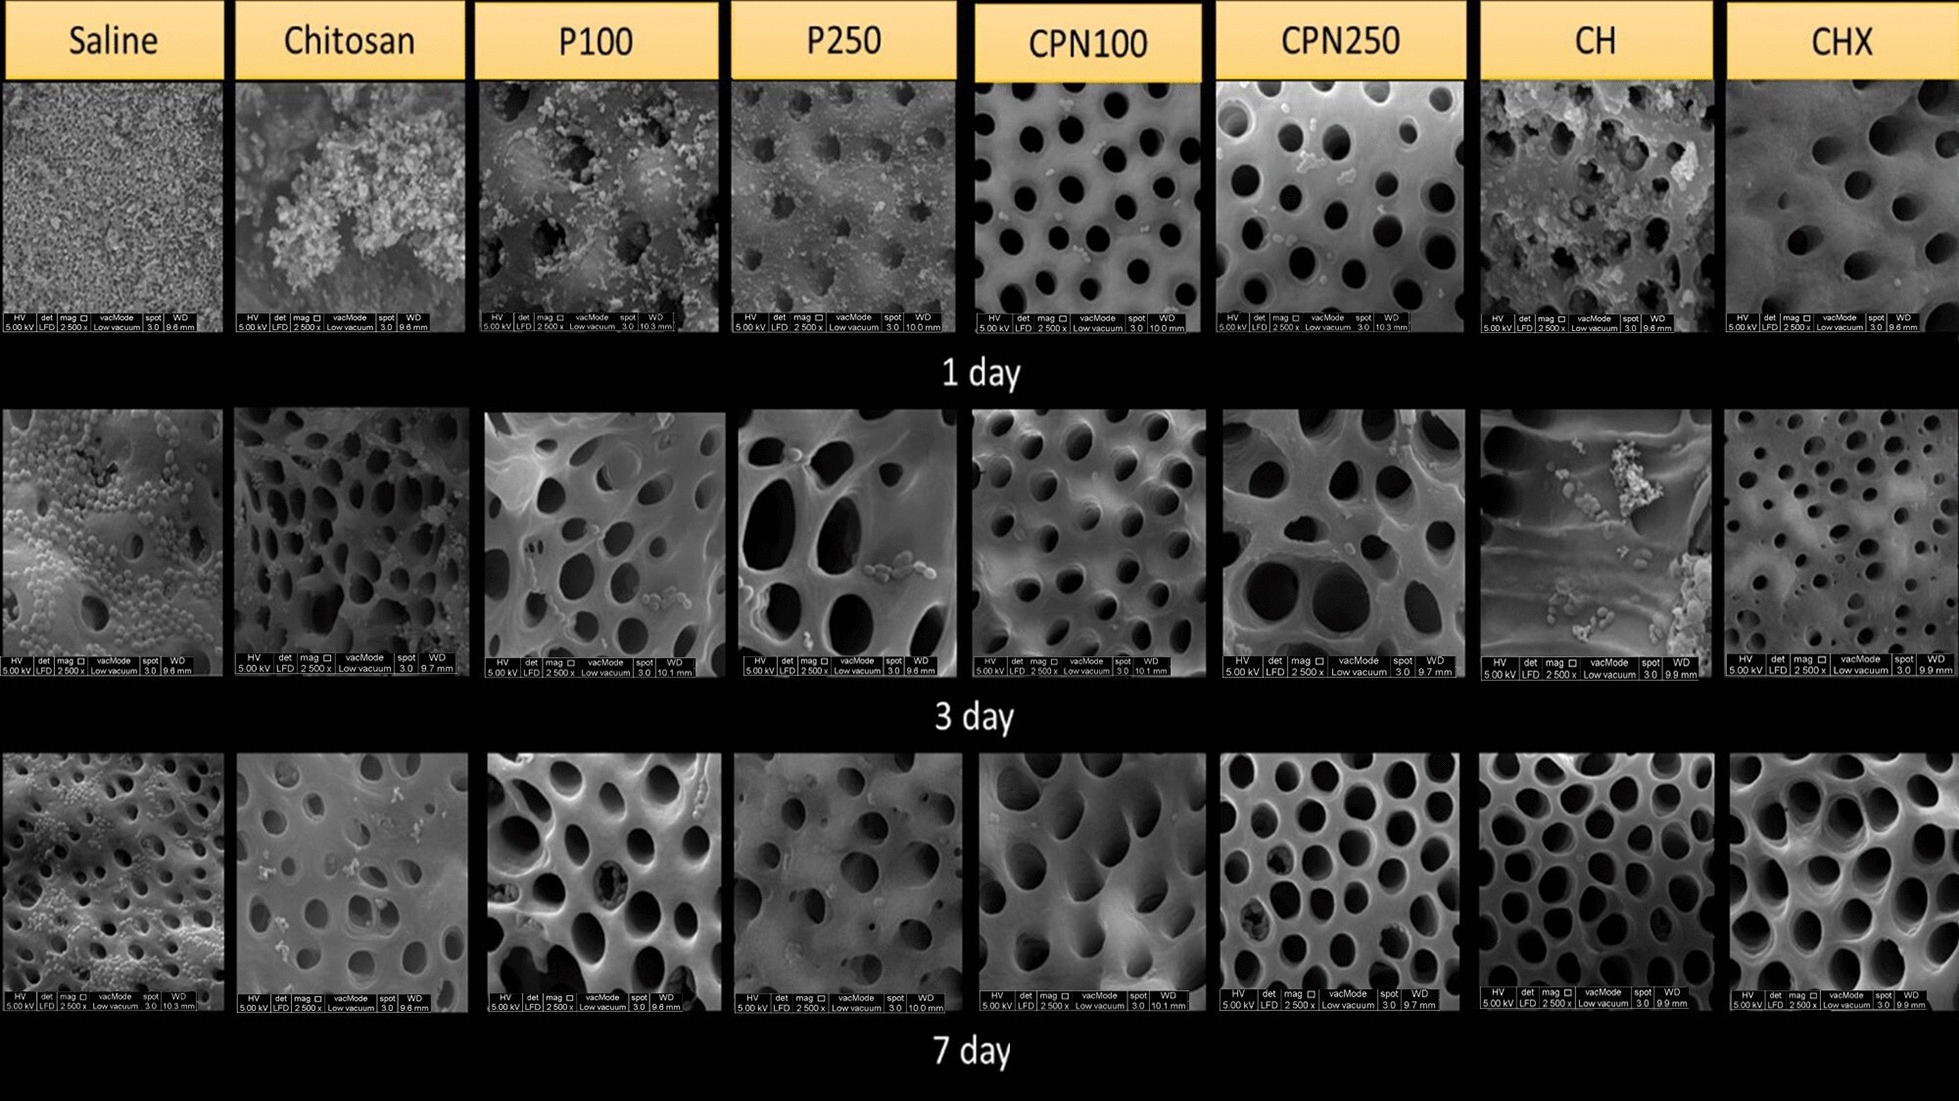
Fig. 3.

SEM images of all groups showing reduction in E faecalis except saline group showing large amounts of E. faecalis. On day one, three and seven saline group showed the highest E. faecalis coverage of 67–100% on SEM images of the canal wall. On day one, CPN250 and 2% CHX showed the least E. faecalis coverage of 5–33% while CH showed 34–66%. On day three CPN250, 2% CHX and CPN100 showed the least E. faecalis coverage of less than 5% while CH showed 5–33%. On day seven, CPN250, CPN100, 2%CHX and CH showed less than 5% of E. faecalis coverage
