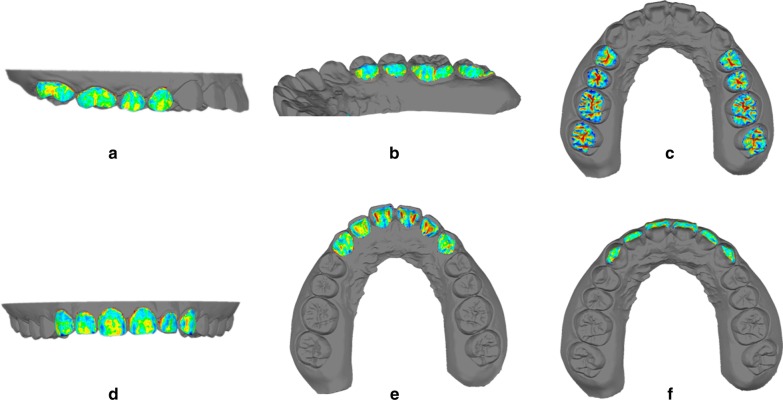
Fig. 2.
The color map shows the differences in different tooth surfaces between the STL reference model and the STL test model. Each tooth surface was individually superimposed on the reference model. a Buccal surfaces of posterior teeth (BP). b Lingual surfaces of posterior teeth (LP). c Occlusal surfaces of posterior teeth (OP). d Buccal surfaces of anterior teeth (BA). e Lingual surfaces of anterior teeth (LA). f Occlusal surfaces of anterior teeth (OA). The darker the color, the larger the variation; the lighter the color, the smaller the variation. Red and blue showed greater deviations than yellow and green

