Fig. 3.
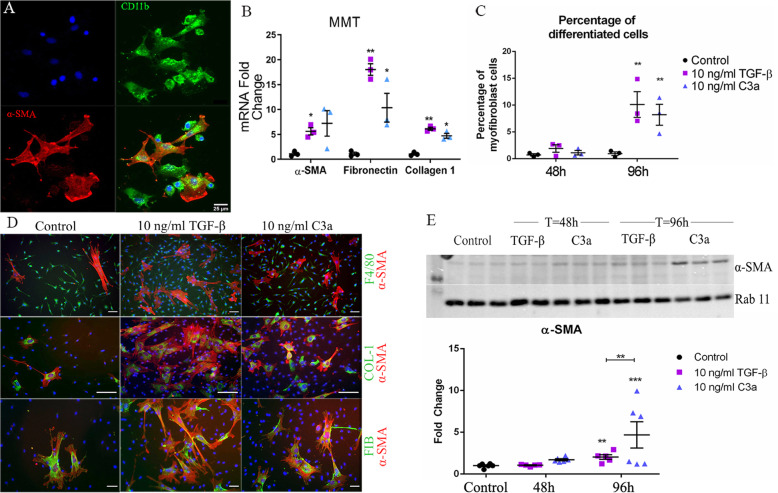
The effects of Complement C3a on BMDMs. BMDMs were treated with 10 ng/ml recombinant TGF-β1 or C3a, and the expression of various myofibroblast markers was investigated. a A confocal image showing CD11b+α-SMA+ cells (arrows) in BMDM cultures 48 h after C3a treatment. Scal bar = 25 um. b qPCR analysis of myofibroblast gene expression after 96 h of TGF-β or C3a treatment. Data presented as mean ± SEM, n = 3 samples, representative of 2 independent experiments. Statistical analysis = Student’s t test—*p < 0.05 treated vs control, **p < 0.01 treated vs control. c The percentage of α-SMA+ cells in BMDM culture after TGF-β or C3a treatment. Data presented as mean ± SEM. n = 3, data shown is representative of 2 independent experiments. **p < 0.01 compared to untreated control of the same time point, Student’s t test. d Representative confocal images of BMDM cultures treated with recombinant TGF-β1 or recombinant C3a for 96 h stained for α-SMA and F4/80 (upper panel) or collagen-1 and α-SMA (middle panel) or fibronectin and α-SMA (lower panel). Scale bars = 50 μm. e Western blot analysis of α-SMA after 48- or 96-h treatment with TGF-β1 or C3a. Image has been cropped for clarity. Data presented as fold change in α-SMA expression compared to housekeeping protein (rab11), mean ± SEM, n = 5–6 samples from 2 independent experiments, **p < 0.01, ***p < 0.005 compared to control untreated cells, Student’s t test

