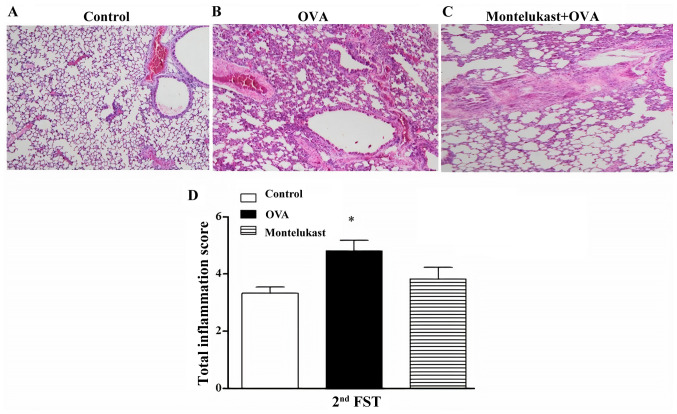
Figure 3.
Histopathological images from the (A) control, (B) OVA and (C) montelukast-treated OVA (20 days of treatment) groups (n=6/group) following the second FST point (40x). (D) Total inflammation scores of the lung tissues of the control, OVA and montelukast-treated OVA groups (n=6/group). Data are presented as mean ± standard error of the mean. *P<0.05 vs. controls. OVA, ovalbumin; FST, force swim test.

