Figure 1.
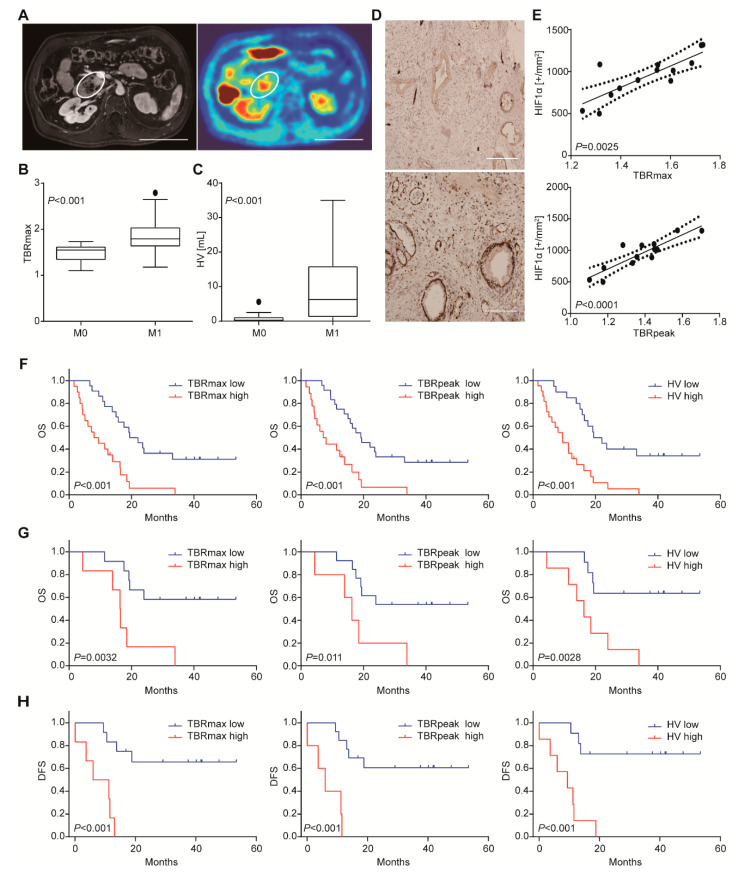
[18F]HX4 uptake correlates with metastatic disease, cellular hypoxia, and poor outcome. (A) An example of contrast MRI (left) of tumor and corresponding PET/CT scan (right) demonstrating the high [18F]HX4 intake area within the tumor. Scale bar: 10 cm. (B) Difference in [18F]HX4 TBRmax and HV (panel C) between patients with M0 and M1 stage disease. Significance was tested by two-tailed Mann–Whitney test. (D) Example of a patient with low (top) and high (bottom) [18F]HX4 uptake and the corresponding HIF1α stained slides of the tumor showing different degrees of cellular hypoxia. Scale bar: 200 µm. (E) Correlation between TBRmax (top), TBRpeak (bottom) and HIF1α positively stained nuclei in the tumor. Kaplan–Meier survival curves discriminating patients based on TBRmax > 1.64, TBRpeak > 1.55 and HV > 1mL. (F) Overall survival for the entire population. (G) Overall survival for patients where the tumor was surgically resected. (H) As for panel G, showing disease-free survival.

