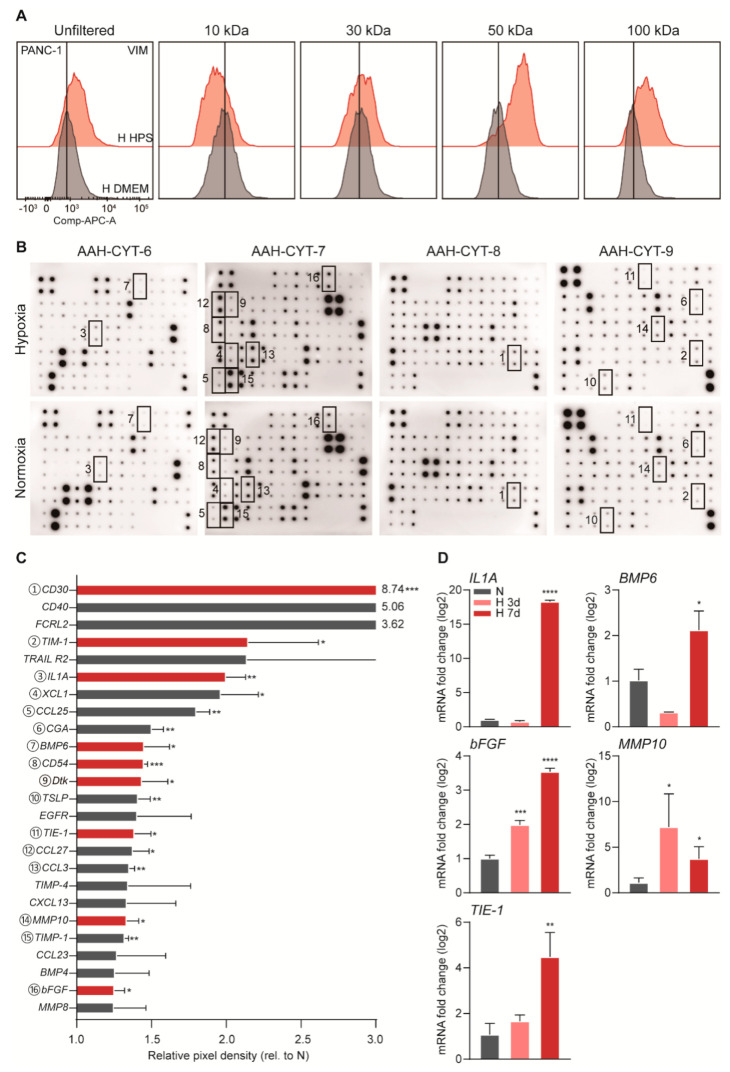
Figure 4.
Candidate stromal cytokines upregulated in response to hypoxia. (A) PANC-1 cells were exposed to 3 days of unfiltered, 10, 30, 50, 100 kDa filtered HPS (upper row peaks) or unconditioned medium (lower row peaks). Flow cytometry was performed for VIM. (B) An AAH-CYT-4000 (RayBiotech, Norcross, GA, USA) cytokine array of four membranes was used to analyze HPS, with NPS as control. Pixel density was determined by measuring spot chemiluminescent signals in ImageJ, and calculated after correction for the negative and positive controls on the membranes and dividing by the NPS control. Coded boxes on membranes scans correspond to matching significantly upregulated cytokines listed in descending order in panel C. (C) All highly induced cytokines are plotted. Statistically significant upregulated cytokines within the size range determined (between 30–100 kD) are shown in red bars (* p < 0.05, ** p < 0.01, *** p < 0.001). (D) PS1 cells were incubated under hypoxia for 3 days or 7 days, with untreated as control. Candidate cytokine levels were determined by qPCR and normalized to control. Candidates of statistically significant upregulation are plotted (* p < 0.05, ** p < 0.01, *** p < 0.001).

