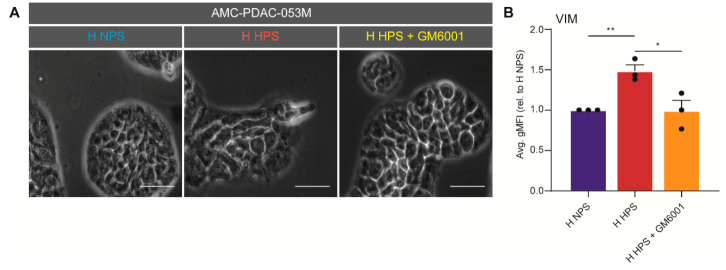
Figure 5.
Tumor cell EMT is driven by MMP10. (A) AMC-PDAC-053M cells were treated with NPS, HPS, and HPS + GM6001 under hypoxia. Scale bar: 20 µm. (B) Expression of VIM in cells were assessed by flow cytometry on PANC-1, AMC-PDAC-053M and AMC-PDAC-067. Data were normalized to NPS group and is shown by average gMFI ± S.E.M. (* p < 0.05, ** p < 0.01). A dot refers to a cell line.

