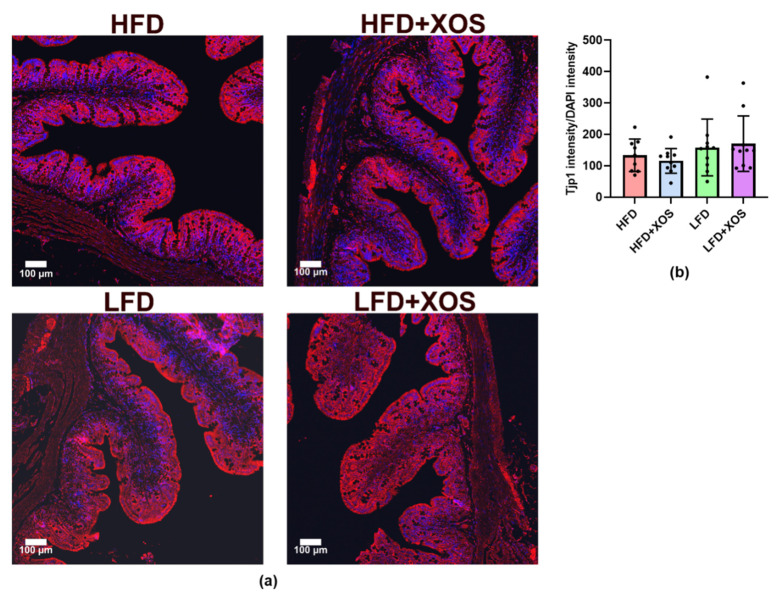
Figure 8.
The intestinal Tjp1 did not differ between the diet groups. (a) The histological images were taken with Zeiss laser scanning microscopy (LSM) 700 and 20 x Plan-Apochromat 20 x/0.8 M27 objective. Tjp1 is shown with red label and 4′,6-diamidino-2-phenylindole (DAPI) in blue. The scale bar is 100 µM; (b) The bars in the graph represent the expression of Tjp1 counted as its intensity using Image J adjusted to the intensity of DAPI. n = 9–10/diet group. The different data points are shown with black dots.

