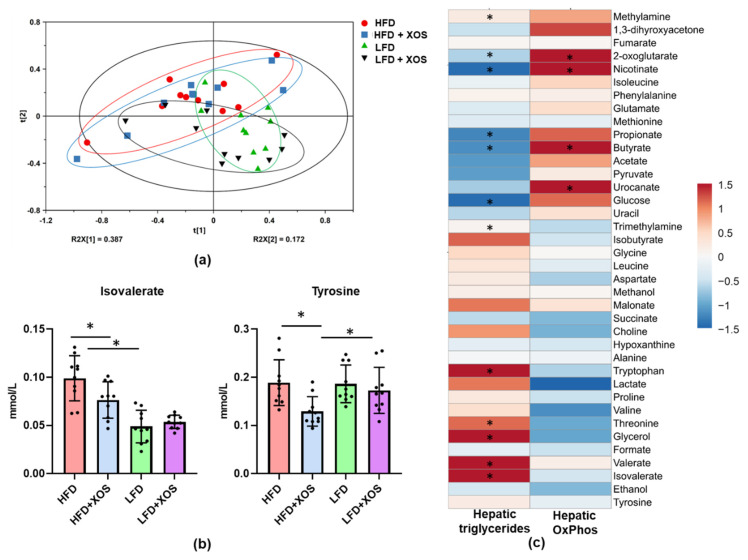
Figure 10.
XOS decreased the levels of cecal tyrosine and isovalerate on the HFD. (a) The score scatter plot of the Principal Component Analysis (PCA) of the cecal metabolites showed no major differences between the diet groups. n = 10/diet group; (b) The levels of cecal tyrosine and isovalerate differed between the diet groups. n = 10/diet group. The different data points are shown with black dots. * indicates significant difference between the groups; (c) The associations of the metabolites with the hepatic triglyceride content and oxidative phosphorylation. n = 10/diet group. The heatmap was drawn using Clustvis, which is a web tool used to visualize clustering of multivariate data (https://biit.cs.ut.ee/clustvis/). However, the clustering is not shown here. * indicates significant association between the variables. The colored scale bar for the associations is shown on the right, and the color corresponds to the value of Spearman’s correlation coefficient.

