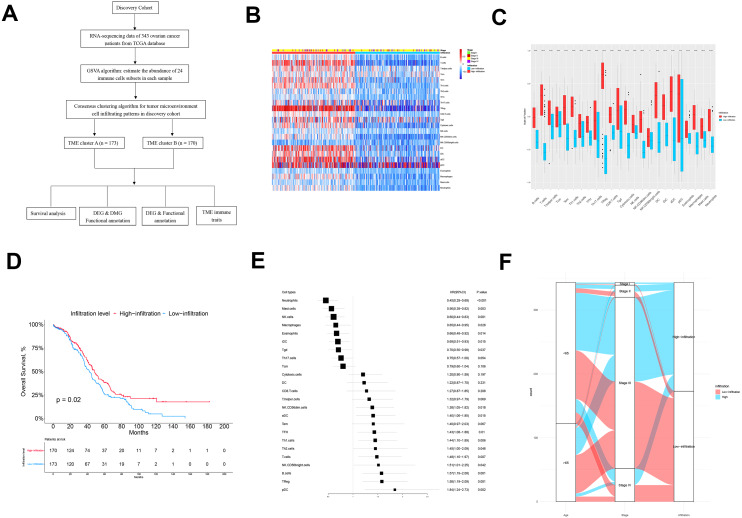
Figure 1. The TME clusters of ovarian cancer from TCGA cohort.
(A) Flowchart of the selection process. (B) Unsupervised clustering of tumor microenvironment immune cells for 343 patients from TCGA. The statistical difference of two TME clusters was compared using the Wilcoxon test. (C) The fraction of immune cells in TME cluster A and B in patients from TCGA. (D) Kaplan–Meier curves revealed that the patients with high infiltration had better OS than those with low infiltration (p = 0.02). (E) Forest plot showing the prognostic value of each type of immune cell. (F) The distribution of baseline information in TME cluster A and B.

