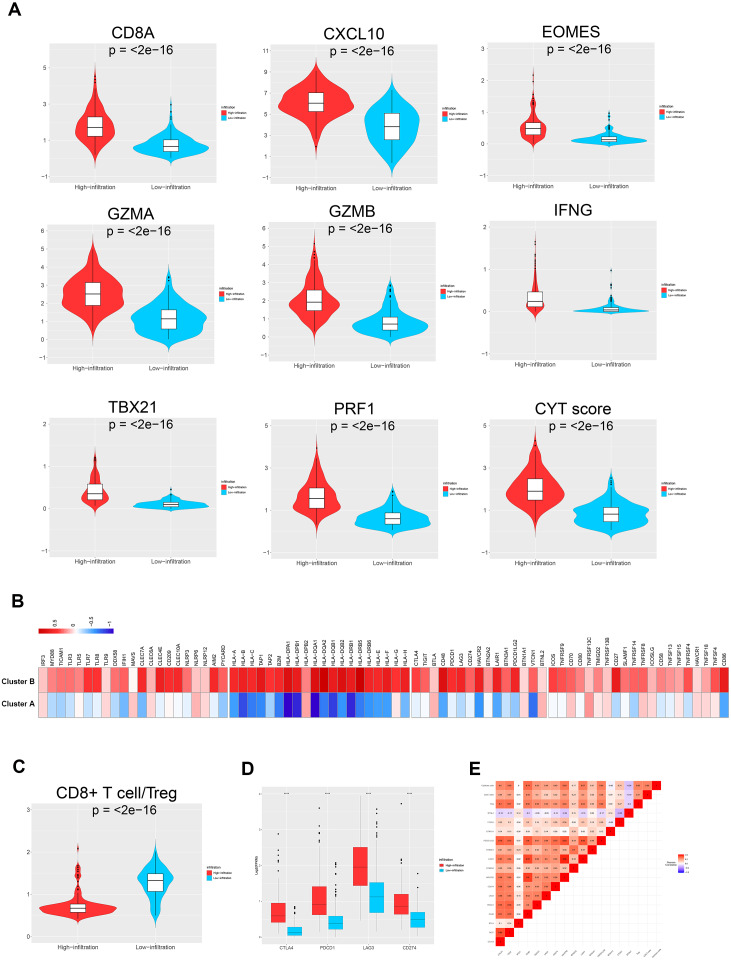
Figure 4. TME immune traits.
(A) Violin plots showing the relative expression of the eight immune-related genes and cytolytic activity (CYT) scores. (B) Relative expression level of molecules potentially involved in initiating innate immunity (left) and those in the MHC-I/II antigen-presenting process (right). (C) Violin plots showing that the CD8+ T cells/Treg ratio was lower in TME cluster B than in TME cluster A. (D) The relative expression level of four important immune checkpoint molecules in the two TME clusters. (E) Correlation between tumor immunogenicity, immune infiltration, immune checkpoint molecules, and mutational load.

