An official website of the United States government
Here's how you know
Official websites use .gov
A
.gov website belongs to an official
government organization in the United States.
Secure .gov websites use HTTPS
A lock (
) or https:// means you've safely
connected to the .gov website. Share sensitive
information only on official, secure websites.
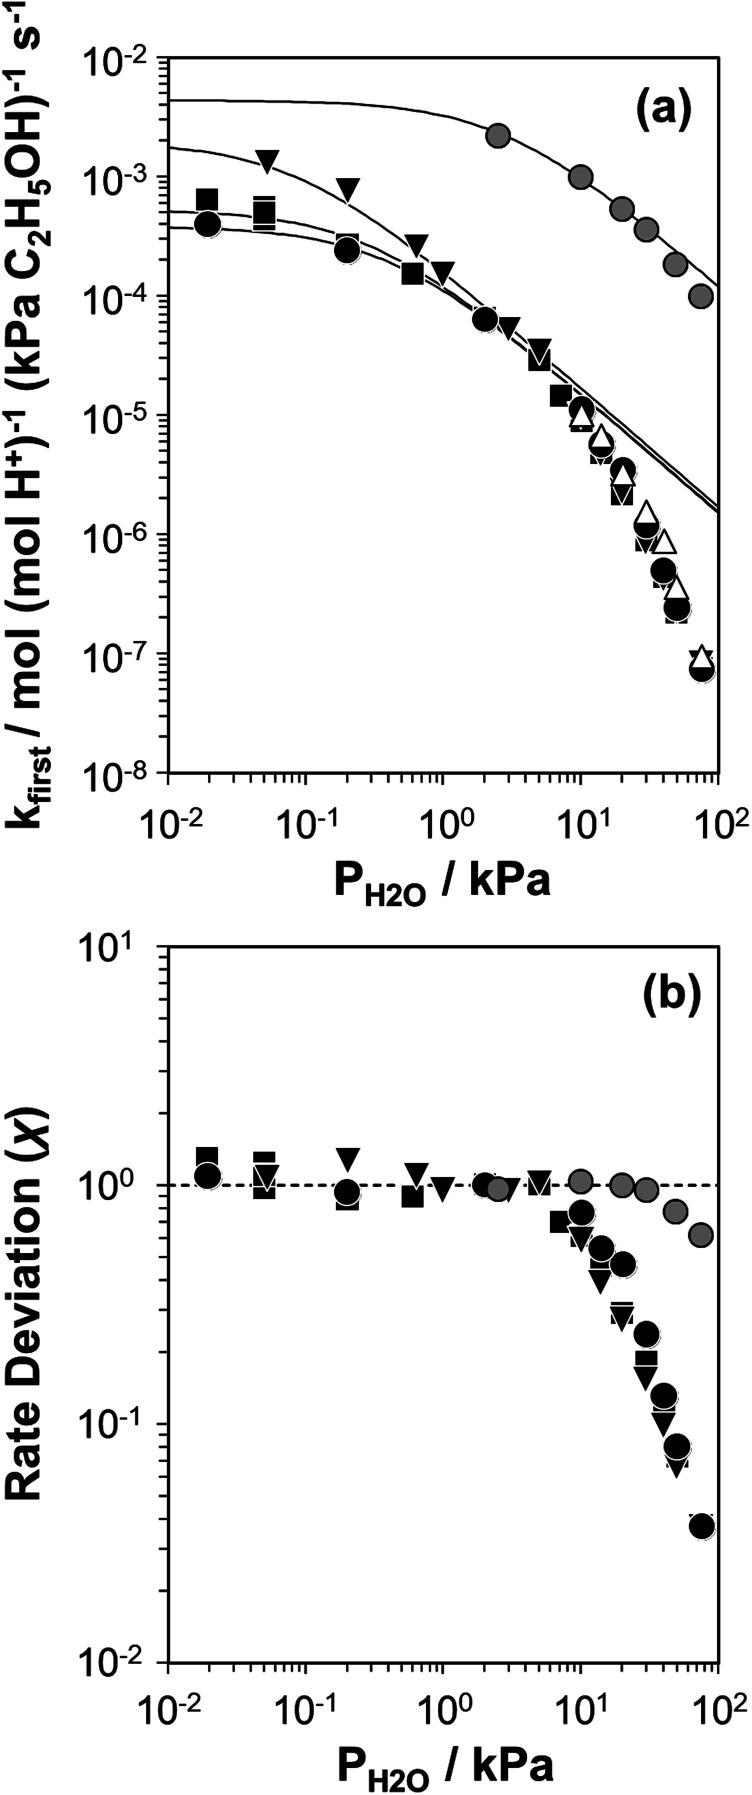
 at 423 K), H-Al-Beta-F(2.0) (■), and H-Al-Beta-OH(1.7) ([blacktriangledown]). Solid lines reflect regression to eqn (6).