. 2020 Jun 18;11(27):7102–7122. doi: 10.1039/d0sc02589e

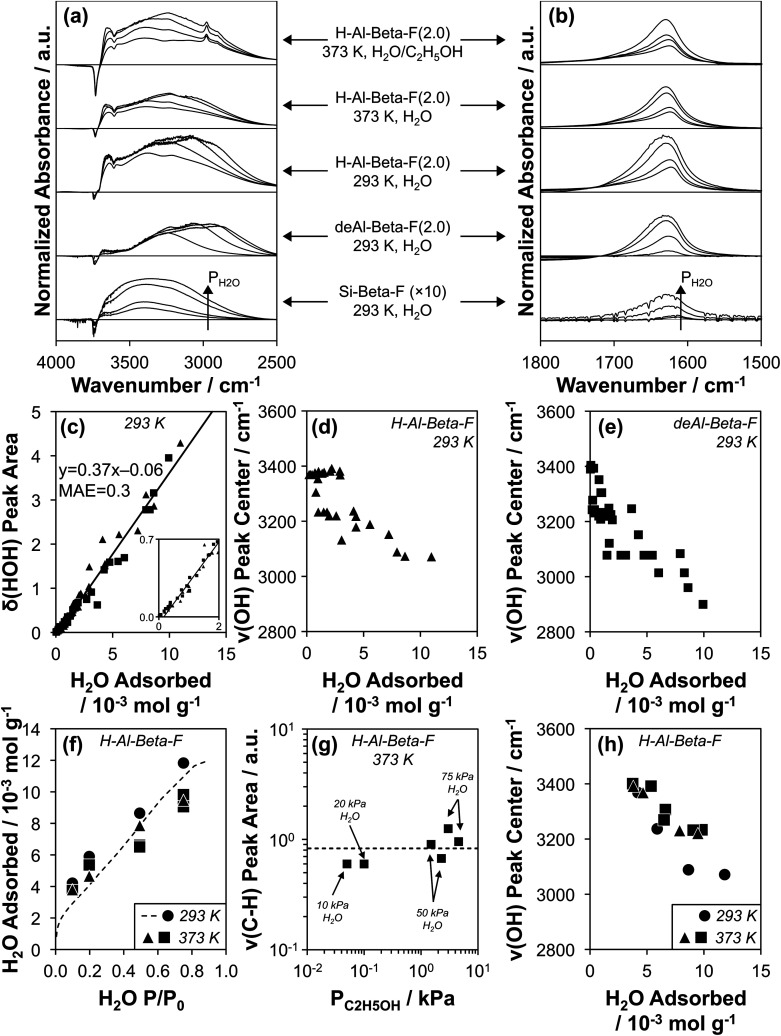
Fig. 4. (a and b) Baseline-corrected, normalized difference IR spectra of H2O adsorbed on Si-Beta-F (×10 for clarity), deAl-Beta-F(2.0), and H-Al-Beta-F(2.0) at 293 K, of H2O adsorbed on H-Al-Beta-F(2.0) at 373 K at H2O P/P0 values of 0.1, 0.2, 0.5, and 0.75, and of H2O adsorbed on H-Al-Beta-F(2.0) with co-fed C2H5OH (C2H5OH/H2O = 0.005 (10, 20 kPa H2O) and 0.03 (50, 75 kPa H2O)), in (a) the ν(OH) stretching region and (b) the δ(HOH) scissoring region. (c) Correlation of δ(HOH) area quantified from subtracted spectra at 293 K on all H-Al-Beta-F (▲) and siliceous Beta samples (deAl-Beta-F, Si-Beta-F, ■) listed in Table 1 with the amount of H2O adsorbed at the same P/P0 in volumetric adsorption isotherms (Fig. 3 and S32, ESI). Solid line reflects line-of-best-fit. (d and e) Correlation of the ν(OH) peak center with the amount of H2O adsorbed on (d) H-Al-Beta-F (▲) and (e) siliceous Beta samples (deAl-Beta-F, Si-Beta-F, ■). (f) Amount of H2O adsorbed on H-Al-Beta-F(2.0) determined from δ(HOH) scissoring areas and the correlation in (c) at 293 K ([black circle]), 373 K (▲), and 373 K with co-fed C2H5OH (■). Dashed function corresponds to the volumetric adsorption isotherm of H2O at 293 K (Fig. 3). (g) Variation in ν(CH) peak area with C2H5OH pressure on H-Al-Beta-F(2.0) at 373 K with co-fed H2O at 10, 20, 50, and 75 kPa. Dashed line represents the average value. (h) Correlation of the ν(OH) peak center with the amount of H2O adsorbed on H-Al-Beta-F(2.0) at 293 K ([black circle]), 373 K (▲), and 373 K with co-fed C2H5OH (0.05–4.6 kPa) (■).

Fig. 4