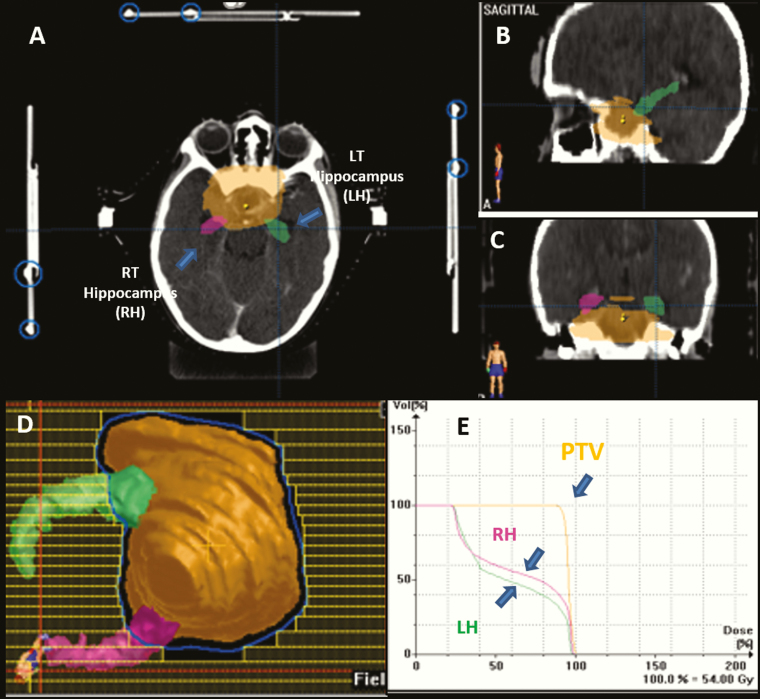
Fig. 1.
Hippocampus as delineated according to the RTOG atlas shown in (A) axial, (B) coronal, and (C) sagittal planes in a representative patient with diagnosis of craniopharyngioma receiving SCRT, (D) beams eye view depicting the prescribed dose wash encompassing the tumor and sparing of the hippocampi, and (E) dose volume histogram showing the dose to the planning target volume and the hippocampus.

