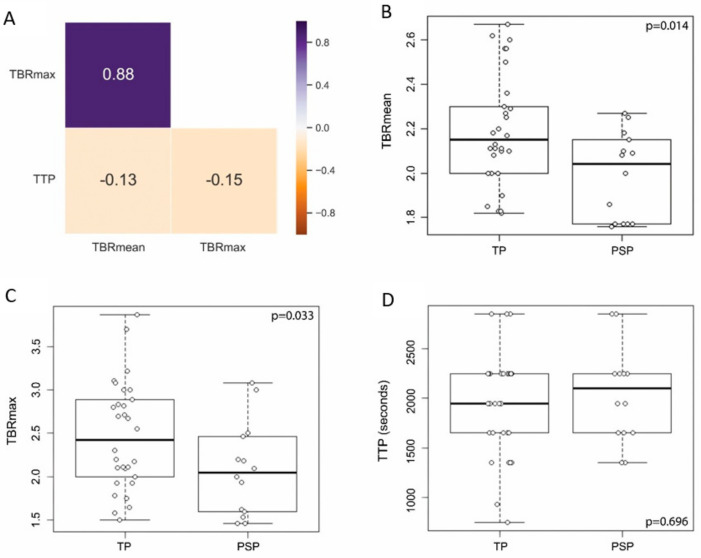
Figure 3.
Correlation and distribution of PET derived features. (A) TBRmax and TBRmean showed a high Pearson’s correlation coefficient (0.88), whereas TTP did neither correlate with TBRmax (−0.15) nor TBRmean (−0.13). Boxplots with overlaid dot plots (B) showing significantly lower TBRmean in the PSP group (mean ± standard deviation (sd), 1.99 ± 0.20) compared to the TP group (mean ± sd, 2.19 ± 0.25) (p = 0.014, Student’s t-test), (C) significantly lower TBRmax in the PSP group (mean ± sd, 2.08 ± 0.54) compared to the TP group (mean ± sd, 2.45 ± 0.63) (p = 0.033, Student’s t-test), and (D) no significant difference in TTP between PSP (mean ± sd, 2036 ± 477) and TP (mean ± sd, 1926 ± 518) (p = 0.696, Student’s t-test).

