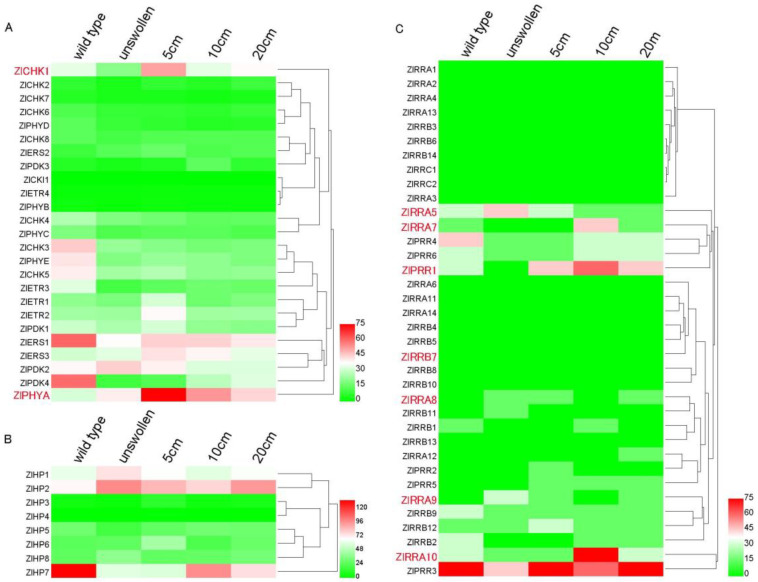
Figure 6.
Heatmap showing the expression of ZlHK(L)s (A), ZlHPs (B), and ZlRRs (C) in Z. latifolia. The expression levels of genes are presented using transcripts Per Million reads (TPM) values and the color scale are shown at the top of heat map. Green represents low expression and red represents strong expression.

