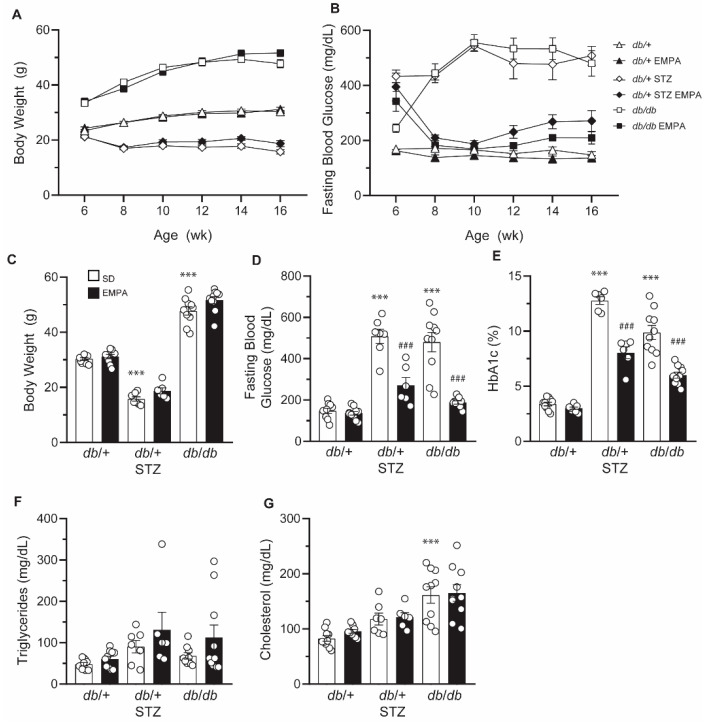
Figure 2.
EMPA improves glycemic control in T1D and T2D mouse models. (A,B) Biweekly body weight measurements (A) and FBG levels (B) in T1D (db/+ STZ), T2D (db/db), and control (db/+) mice with/without EMPA; n = 6–10 mice per group. (C–G) Terminal body weight measurements (C), FBG levels (D), %HbA1c (E), triglyceride plasma levels (F), and cholesterol plasma levels (G) in T1D (db/+ STZ), T2D (db/db), and control (db/+) mice with/without EMPA; n = 6–10 mice per group; *** p < 0.001 for untreated control vs. untreated T1D and T2D; ### p < 0.001 for untreated vs. treated T1D or T2D; by one-way ANOVA. Data are expressed as the mean ± s.e.m.

