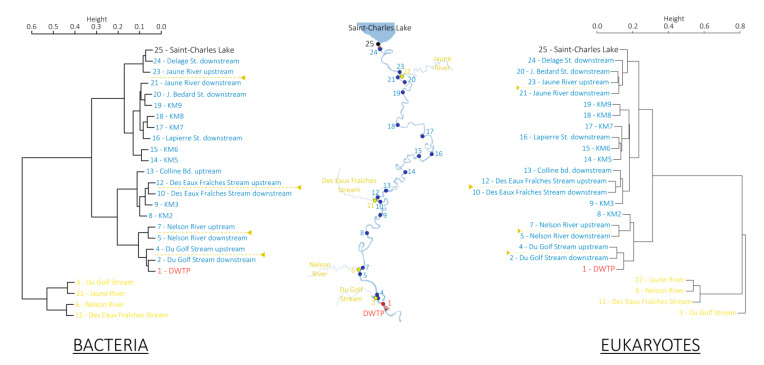
Figure 4.
Unweighted Pair Group Method with Arithmetic mean (UPGMA) dendrograms based on Bray–Curtis distances representing bacterial communities (left) and eukaryotic communities (right). Samples collected from the Saint-Charles River are represented in blue and red (the most downstream sampling point), those collected from the tributaries in yellow and sample collected from the Saint-Charles Lake in black. Locations of confluences between the Saint-Charles River and the tributaries are illustrated by the yellow dotted lines on the UPGMA dendrograms.

