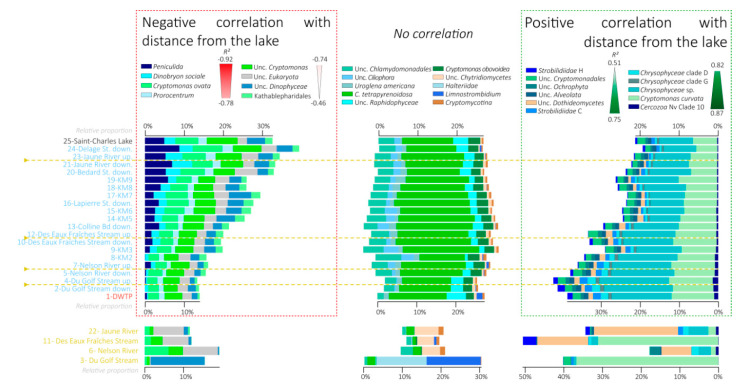
Figure 8.
Bar chart representing the variation in relative proportions of the main eukaryotic lineages. Variations in the Saint-Charles River from the lake to the DWTP are represented at the top and variations in the tributaries are represented at the bottom. Eukaryotic lineages are sorted in bar charts by correlation with distance from the lake (R2 scale in the caption) with the lineages the more negatively correlated with distance from the lake at the left and lineages the more positively correlated with distance from the lake at the right. The three categories are defined based on statistically significant correlation (negative correlation, no correlation, and positive correlation, p-value < 0.05). The other eukaryotic lineages with low proportions (<0.5% of total sequences in the entire dataset or a minimal number of sequences of 2519) are not represented on this figure (representing between 14.6% and 21.5% of sequences). Unc.: Unclassified.

